3.1 Testing location and animals
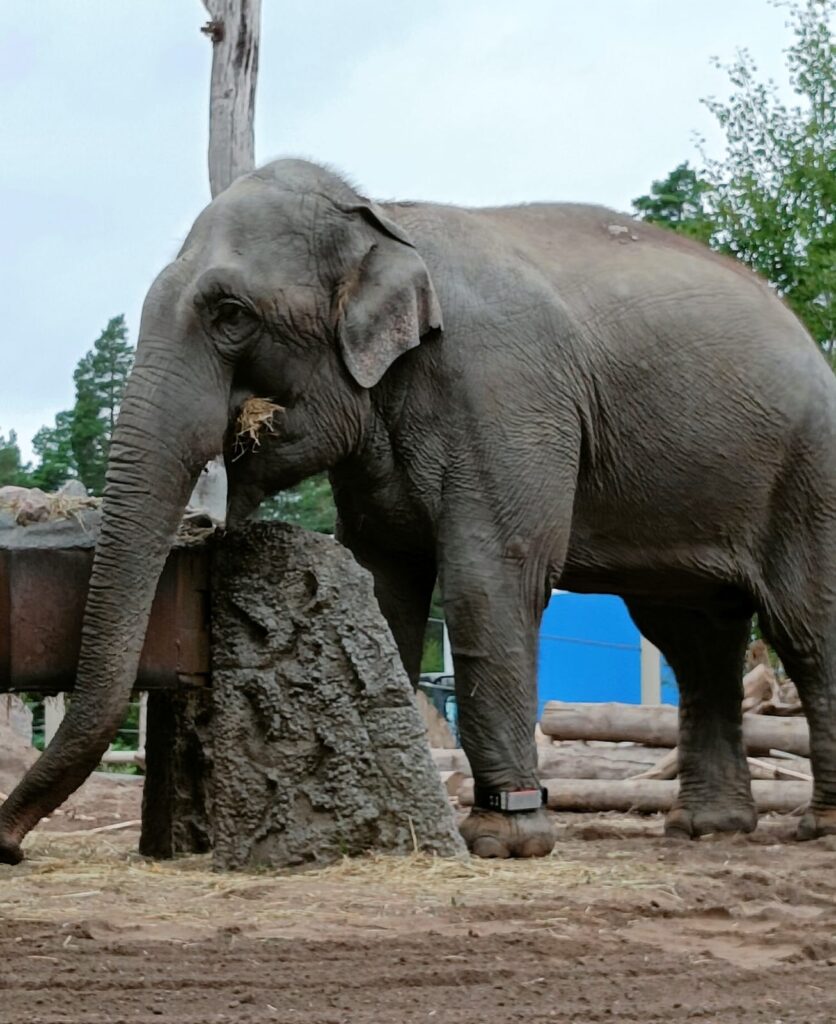
The testing was carried out at Kolmården Wildlife Park, Sweden (KWP) which houses three adult Asian elephants – one male and two females. Data was collected from Saonoi, one of the two female elephants.
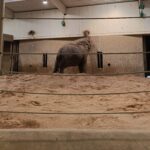
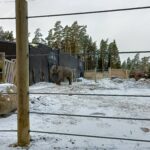
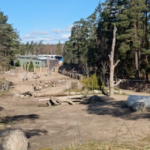
The elephants at KWP have four enclosures available to them. Two indoor enclosures (Fig 1) with visitor access with an attached smaller outdoor enclosure (Fig 2) which the visitors do not have access to and one larger outdoor enclosure with visitor access (Fig 3). Both indoor enclosures are divided into two sections, one section is a concrete floor, used for daily animal care (ex.: foot care, daily check-up, etc.) and the other section is filled with sand to facilitate the overnight stay of the elephants (Fig 1). At any given time, the elephants either have access to the two indoor enclosures and the smaller outdoor enclosure or the larger outdoor enclosure, but not both at the same time.
3.1.1 Training
Training for the study was done in two phases:
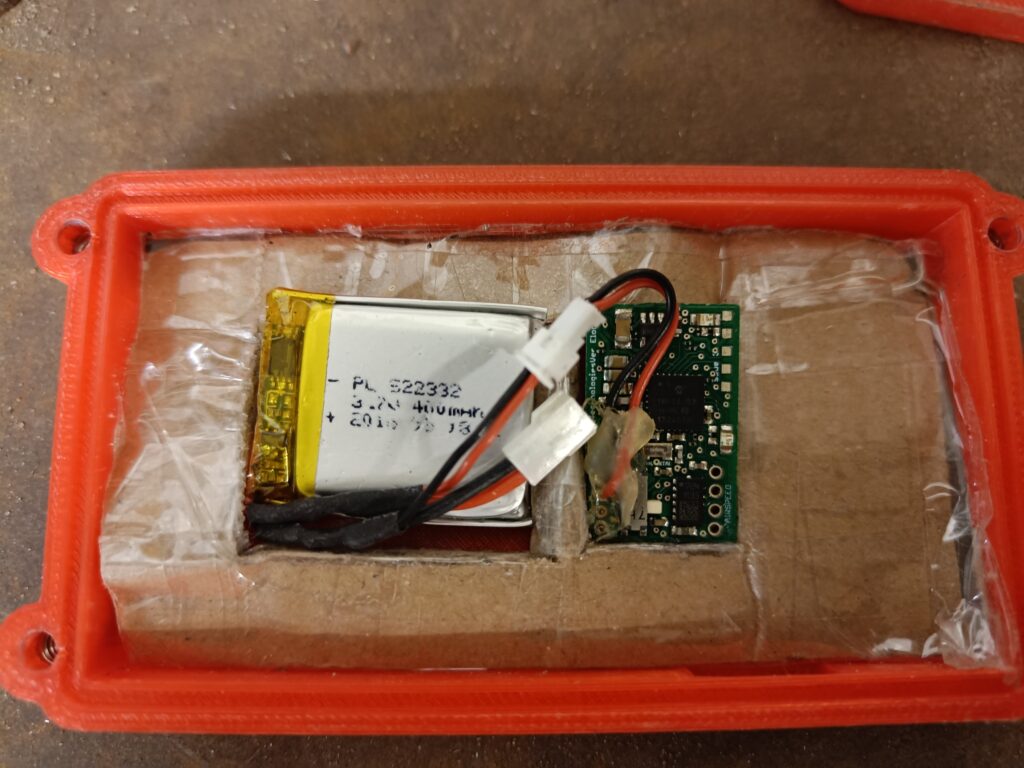
- Phase 1: Saonoi was trained to wear an ankle bracelet. The Daily Diary tag was placed inside a carrying case that was attached to the ankle bracelet, which was then fitted on her left front leg.
- Phase 2: once the ankle bracelet was successfully mounted, she was trained to perform movements – walking forward and walking backward – along a predetermined path in one of the sand-filled parts of one of the indoor enclosures.
For the safety of the animals, staff, trainers, and myself, all training of the elephant was performed in protected contact by the zookeepers at KWP.
3.2 Test sessions
Data collection was performed in five different sessions. A total of 17 hours 42 minutes and 16 seconds of data was collected over the span of five different sessions.
3.2.1 Activity logging
I used a Daily Diary tag that was connected to an external battery to collect tri-axial acceleration data from Saonoi. During the sessions, the triaxial acceleration sensors recorded the data at a frequency of 40 Hz (i.e. 40 data points with acceleration measures were recorded per second).
3.2.2 Behavioural observations
Each test session was video recorded and later analysed to obtain visual confirmation of the number of steps taken by Saonoi. I defined a step as the movement of the leg with the ankle bracelet, where the foot completely left and then came back to the ground in the same or a different position or spot. Any movement where the foot was either dragged across the ground or was only partially lifted from the ground was not counted as a step.
For this study, I did not differentiate the directionality of the step. Forward, backward, and sideward movement of the foot were all recorded as a step as long as the movement fulfilled the conditions outlined in the definition.
3.3 Data collection
Data was collected over five sessions between January 24th and February 3rd, 2023. Each session consisted of two parts:
- Trained-walk: Saonoi was made to walk between points A and B in the indoor enclosure.
- Free-activity: Saonoi was allowed to move around the enclosure as she pleased, both indoors and outdoors. For the first session, access to enclosures was limited and Saonoi was only allowed access to the indoor enclosure that was used for the trained walking part of the sessions. She had access to the larger outdoor enclosure only during two sessions. The free-activity period made up the majority proportion of the collected data.
3.4 Data analysis
Data from the test session was extracted using the DDMT software for each session separately. The extracted data files were loaded into the DDMT software for analysis.
3.4.1 Algorithm design
To detect steps from my data I used the peak detection method. The peak detection method identifies spikes in signal data to mark instances when the behaviour likely occurred in signal-based data such as an accelerometer. These spikes correspond to changes in the signal channel reading that reaches a pre-determined threshold. Due to a lack of comparative studies, I based my algorithm on peak detection methods used in human step detection.
Instead of using the raw tri-axial acceleration, I used a derived measure of the acceleration called vector of the dynamic body acceleration (VeDBA) for my algorithm which is automatically calculated by DDMT. The software uses the following equation to derive VeDBA from raw accelerometer data:

The algorithm parameters were determined after first analyzing a small subset of data from each session, with the subsets chosen to ensure that the algorithm parameters worked for various conditions (ex.: walking on different ground substrates, walking up and down the elevated ground, etc.). The parameters in this study were used because they showed the most optimal results for the available data and require further verification. The data used in this study is available for download.
Following are the steps, in sequence, I performed in DDMT to detect steps in the accelerometer data collected from Saonoi.
- Channel smoothing: signal processors like motion sensors often pick up a lot of noise while logging data which can interfere with analysis that performs peak detection and smoothing removes a majority of the noise that interferes with the actual signal making peak detection more accurate. I smoothed the raw VeDBA measure by a factor of 35.
- Calculating differential: I processed the smoothed VeDBA channel through the differential function to allow peak detection. Prior to peak detection, I smoothed the differential channel by a factor of 17 to further remove noise from the signal.
- Identifying “active” parts of data: prior to using the peak detection function, I marked the parts of the data file for which I had video evidence as active. This excluded all parts of the data for which the corresponding visual observations were not recorded.
- Peak detection: I used the turning-point function on the “active” parts of the data file to find peaks in the differential channel. This function detects a peak based on the deviation relative to zero and only peaks that cross the deviation threshold are marked by the software. The deviation is higher for points with high magnitude and as there were a few data points that had a very high VeDBA magnitude, multiple peaks that corresponded with actual steps were left undetected. Thus, I performed this step on small sections of data.
- Filtering: All detected peaks were filtered to remove the high-magnitude peaks. I manually set the filter threshold by checking the magnitude reading of these peaks.
- Marking: The filtered peaks were then bookmarked with the total number of bookmarks representing the total number of steps detected in the data file. I further filtered the bookmarks to account for the double counting of steps that were missed in the previous filtering stage by combining consecutive bookmarks that were too close together based on a pre-determined threshold (less than 60 events or data points).
3.4.2 Video analysis
The total number of steps from each video was entered into an MS Excel worksheet, which was then combined with the total step count obtained from DDMT for statistical analysis. The number of steps obtained from data analysis in DDMT were termed “defined” steps and the number of steps obtained from video analysis were termed “observed” steps.
3.5 Statistical analysis
Statistical analysis for this study was performed using MS Excel, R, and RStudio.
3.5.1 Percent accuracy
The total number of steps from each session was used to calculate the accuracy of the algorithm. To calculate the percent accuracy of the algorithm the following equation was used:

3.5.2 VeDBA analysis
As a result of the high sensitivity of biosensors, differences that may be difficult to observe with the naked eye can often be found in sensory data. To see if any such differences were present in this study, I compared the VeDBA between the indoor and outdoor enclosures. Steps from three 15-minute data subsets were extracted from session 2. The first subset included VeDBA data from the elephant moving on the sand in the indoor enclosure (Fig 1). The second and third subsets included VeDBA data from the elephant moving in the big outdoor enclosure (Fig 3) and the smaller outdoor enclosure (Fig 2) on a harder mud-covered surface.
To check for any differences in VeDBA measure between the three enclosures, I used the mean VeDBA measure, calculated for each step, as extracted from DDMT. I performed the following statistical tests:
- Shapiro-Wilk test to check the normality of the data.
- Kruskal-Wallis test on the mean VeDBA measures from the three enclosures.
- A post-HOC Dunn test to test which enclosure type was significantly different from the other.
The significance level for all tests was set at 0.05.