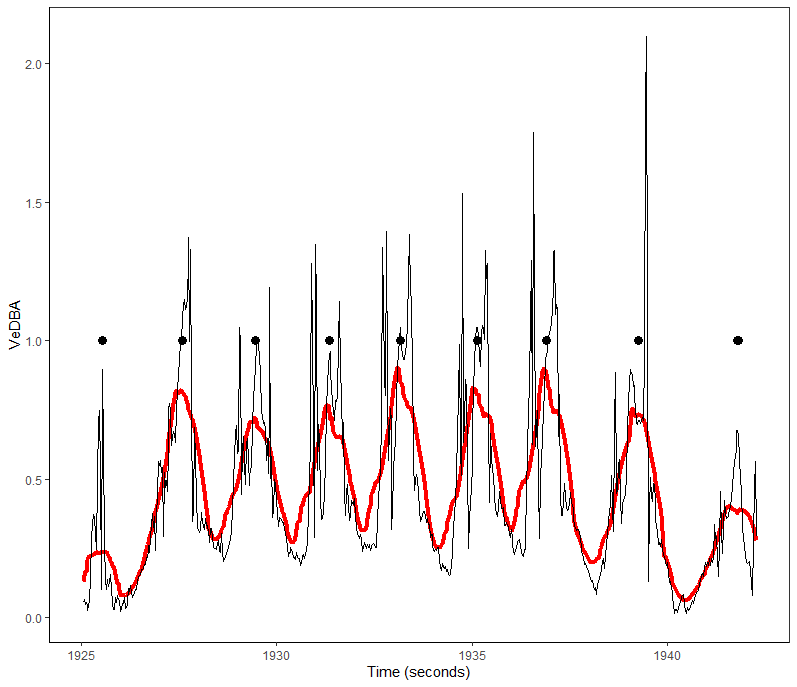
The step-detection algorithm used in this study used a peak detection method to detect steps through the variance in accelerometer reading. Vector of the dynamic body acceleration (VeDBA), a metric derived from tri-axial acceleration, was processed and analysed using the peak detection method to detect steps. The parameters for the algorithms were set after analysing a small subset of data from each session.
4.1 Percent accuracy
The total number of steps, both defined and observed from the trained-walk and free-walk period of the test sessions, as well as the percent accuracy for each session is summarised in the table below.
| Session | Observed steps | Defined steps | Difference | Percent accuracy |
| 1 | 203 | 203 | 0 | 100.0 |
| 2 | 951 | 1018 | 67 | 93.0 |
| 3 | 1045 | 1120 | 75 | 92.8 |
| 4 | 892 | 905 | 13 | 98.5 |
| 5 | 662 | 689 | 27 | 95.9 |
The percent accuracy for each session was calculated separately. The lowest accuracy was observed for session 3 at 92.8% and the highest accuracy was observed for session 1 at 100%. The average percent accuracy for the algorithm was found to be 96.0%.
4.2 VeDBA analysis
I compared the mean VeDBA between the three enclosures – indoor, big outdoor, and small outdoor enclosures. A Shapiro-Wilk test revealed that the data was not normally distributed (p<0.05). Thus, a Kruskal-Wallis test was performed.
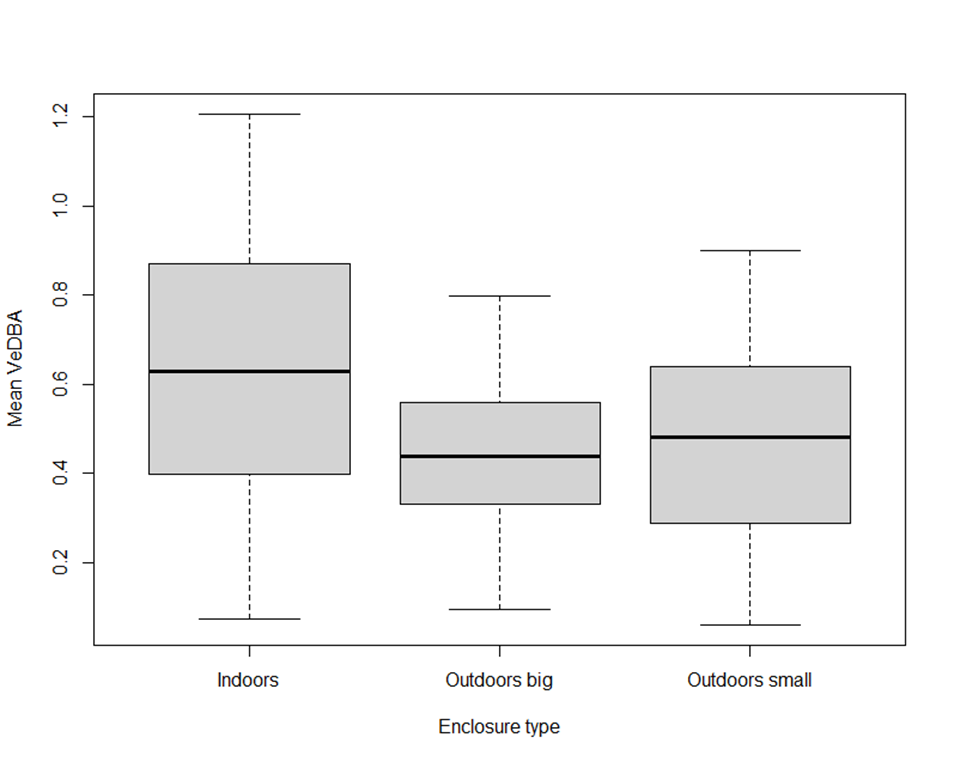
The number of steps was used as the sample size for the three subsets. The Kruskal-Wallis test (Kruskal-Wallis chi-squared = 25.36, p<0.001, df = 2) revealed that the mean VeDBA measures significantly differed between the three groups – indoor enclosure (0.625 + 0.284, n = 130), large outdoor enclosure (0.439 + 0.171, n = 60), and small outdoor enclosure (0.474 + 0.222, n = 107). The post HOC Dunn test showed a significant difference in the mean VeDBA between the indoor enclosure and big outdoor enclosure (p<0.001) as well as between the indoor and small outdoor enclosure (p<0.001), but not between the two outdoor enclosures (p = 0.986).