Visualization of ES bundles in all gardens studied: Overall, residential gardens provided more ecosystem service bundles than allotment gardens for both periods. Furthermore, residential gardens in rural and peri-urban areas provided more ecosystem service bundles than urban gardens. However, urban gardens provided more cultural services than other ESS. In addition, residential gardens showed higher nutrient balances when compared to allotment gardens. Comparing these nutrient balances with different studies from other countries, residential gardens in Sweden had the highest nitrogen balance. However, this was not the case for the phosphorus balance since the result from a study in Canada had the highest.
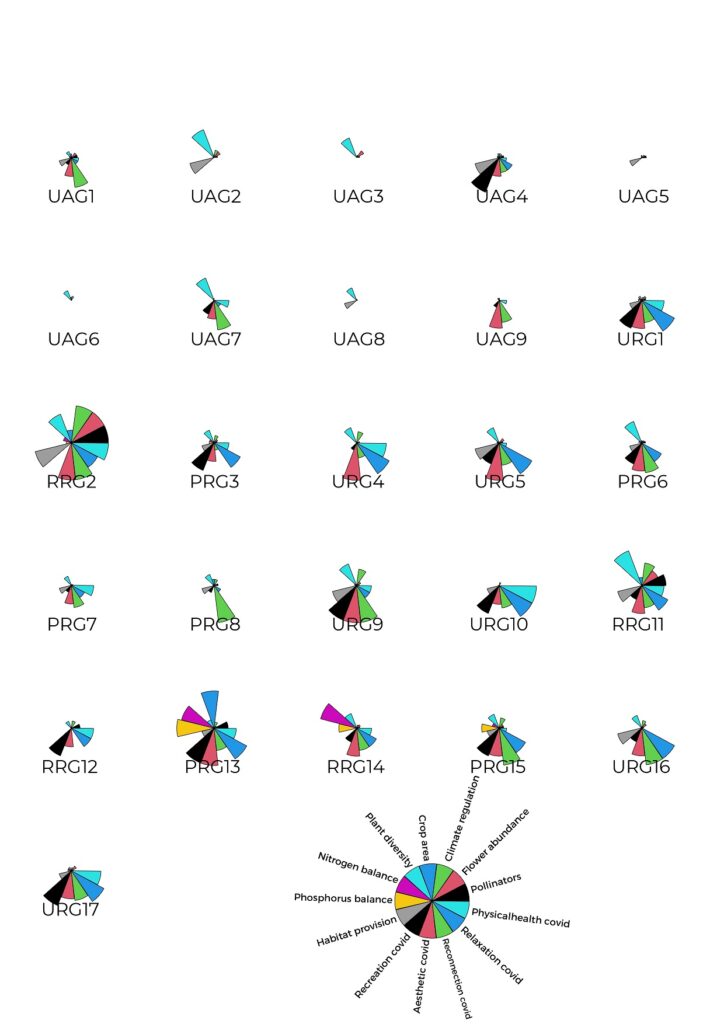
Ecosystem services bundles provided by each garden (Urban allotment (UAG), Urban residential (URG), Peri-urban residential (PRG), Rural residential (RRG)).
Effects of management intensity on urban gardens: Three levels of management intensity were identified in the gardens: a high-intensity managed, medium-intensity managed, and overgrown garden. High-intensity managed gardens were lowest in rural areas (n=3) and highest in urban areas (n=8), while there were just four in peri-urban areas. Seven medium-intensity gardens were found in urban areas, while peri-urban areas had 2. Overgrown plots were evenly distributed between urban and rural areas (n=1 each).
A visual assessment of ESS across the three management intensities of urban gardens showed that medium-intensity managed gardens had more flower abundance, pollinators, and nutrient balances than high-intensity/overgrown gardens. However high-intensity gardens had more plant diversity and trees.
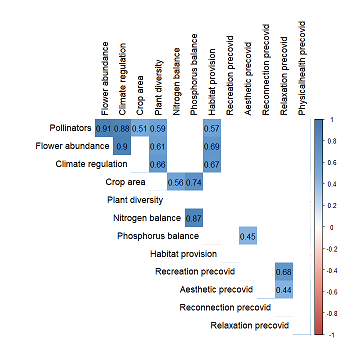
Interaction among ES bundles: To see the difference in correlation between pairs of ESS, I compared the correlations of all services in the pre-covid period with those during the Covid period.
For the pre-covid period, a total of 16 pairs of ESS were positively correlated and of statistical significance. Pollinators had the highest number of positive correlations with other ESS (significantly correlated with five services). A lower number of positive correlations were found for flower abundance, climate regulation, crop area, N balance, P balance, recreation, and aesthetics (significantly correlated with three, two, two, one, one, one, and one services, respectively). There were also negative correlations between 11 pairs; however, none were statistically significant.
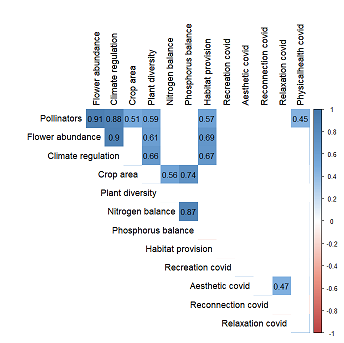
For the Covid period, 15 pairs of ESS were positively correlated and of statistical significance. Pollinators had the highest number of positive correlations with other ESS (significantly correlated with six services). A lower number of positive correlations were found for flower abundance, climate regulation, crop area, N balance, and aesthetics (significantly correlated with three, two, two, one, and one services, respectively). However, there were no statistically significant negative correlations between 13 pairs of ESS. In addition, no statistically significant correlation between plant diversity and physical health could be seen (Pearson coefficient; r =0).
Comparison of cultural ESS provisioning before and after Covid: As perceived by respondents, the most important cultural service during the pre-covid and Covid period on the Likert scale of 5 was relaxation, with 38 % and 57 %, respectively. On a Likert scale of 5, all the cultural services were used more during the Covid period except for physical health which was the same for both periods. In addition, on a Likert scale of 1-4, the garden was used more for cultural services during the pre-covid than the Covid period.