Study area
The gardens studied in this research were within the urban, peri-urban, and rural areas in Linköping Municipality. Of the 26 gardens studied, 9 were urban allotments (AG), and 17 were residential (RG). The gardens differed in size, vegetative characteristics, and management intensity. Allotment gardens were randomly selected from an ongoing “Urban agriculture as a blue-green infrastructure” project at Linköping University. In the case of residential gardens, several channels (e.g., flyers and personal invitations were used to invite people to participate in the study.
Data collection
In June and July 2022, data was collected using observations and structured interviews to measure 13 different ESS. Each garden was visited twice between 9.00 and 17.00 on sunny days with temperatures of around 15oC to 30oC. All data for cultural services were taken for two periods( pre-covid and Covid ). In addition, a Likert scale of 0-5 (0 is none and 5 is high) was used to rate how garden owners perceived these cultural services.
Observation process
Observation process via onsite garden assessment was carried out to measure provisioning, regulating, and supporting services.
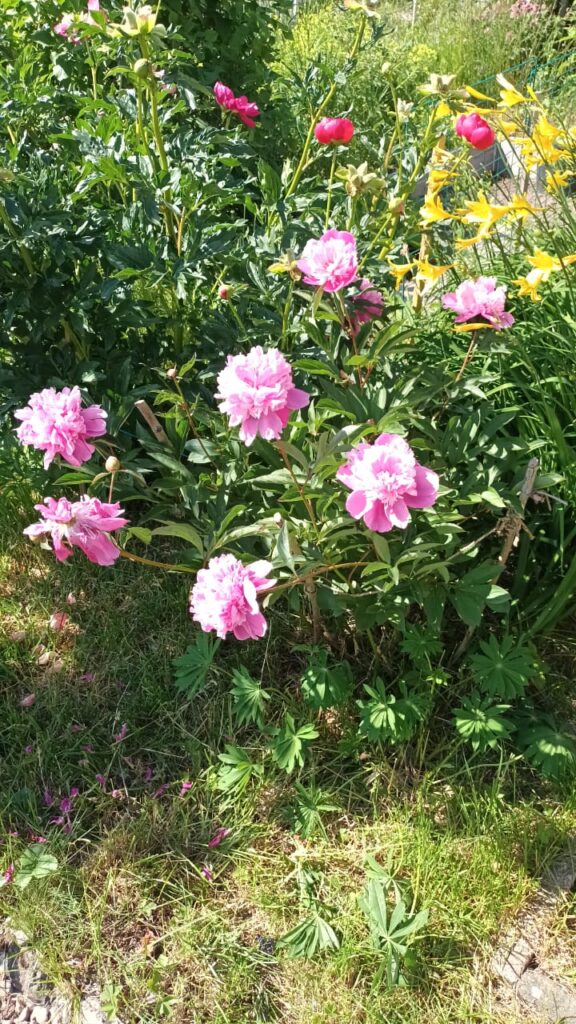
Provisioning services: This is the provision of goods by the ecosystem. For my study, I assessed plant diversity, flower abundance, and crop area. Plant diversity was measured by the total number of plants and flower diversity present in the garden. Flower abundance was the total estimate of flower abundance, while crop area is the size of the area in the garden where crops were planted.
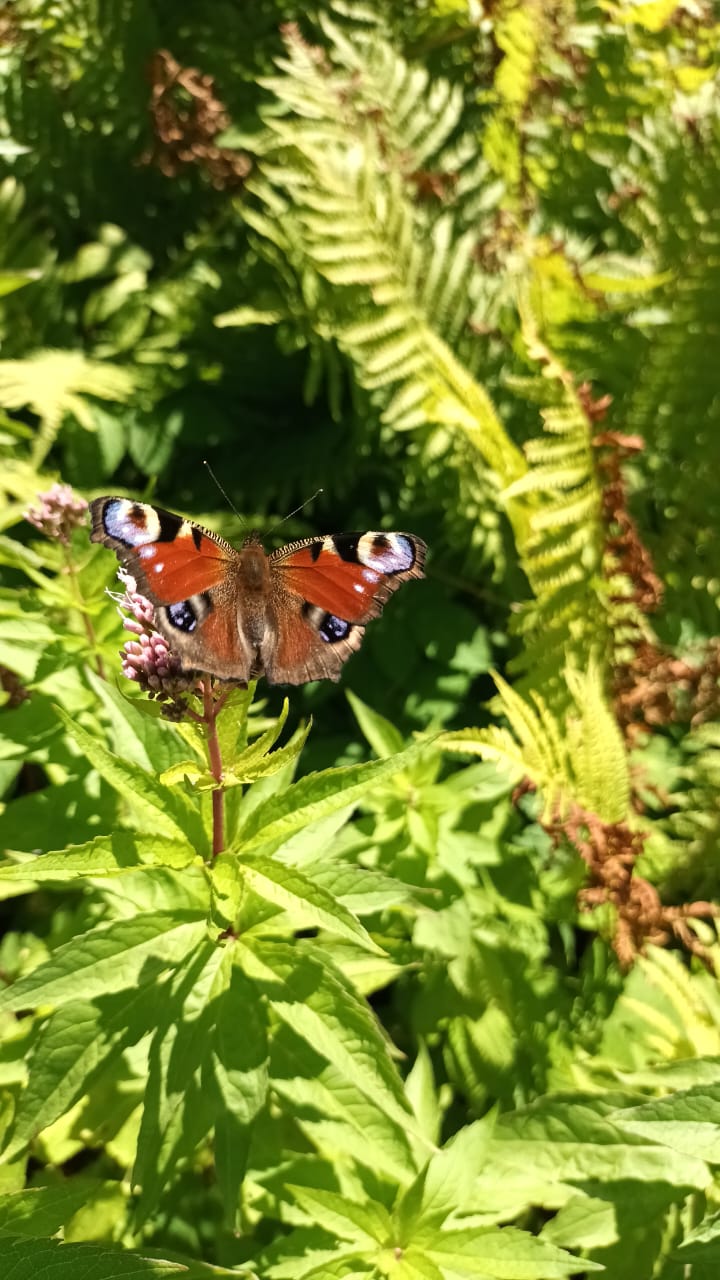
Regulating services: are the production of services through the regulatory function of the ecosystem. I assessed pollination and climate regulation in my research. Pollination was measured by the presence of bumblebees and butterflies during my garden visits. Climate regulation was the number of trees present in the garden.

Supporting services: are services needed to produce other services. This includes habitat provision and nutrient cycling. However, only habitat provision was measured by onsite garden assessment of the presence of dead trees, artificial beehives, and bird nests.
Structured interviews
Structured interviews through the use of questionnaires were used to collect data for nutrient cycling and cultural services.
Nutrient cycling: Questionnaire was used to collect the type and amount of manure/fertilizers added to gardens. This information was used to calculate the nutrient input (nitrogen and phosphorus) in the garden. Using the total cultivated area in each garden multiplied by a predetermined average nitrogen and phosphorus output, the nutrient output was calculated. The difference between the nutrient input and output was the nutrient balance. The nutrient balance is the amount left in the soil which can be recycled.
Cultural services: are non-material services provided by the ecosystem. Different ways garden owners perceived aesthetic appreciation (garden beautification), nature reconnection( watching plant and animal biodiversity), relaxation, physical health(exercise), and recreational activities (social gathering) were measured on a Likert scale of 0-5 for two periods (pre-covid and Covid).
Data analysis
Garden management intensity: The management intensity of the gardens studied was based on a visual assessment of their vegetative structure. I used the allotment gardening association enforcement code to classify the management intensity of the gardens. A high intensity plot is a well-maintained garden with regular mowing, while a medium intensity plot has small or no lawns with noticeable weeds and unmanaged areas. An overgrown plot is an overgrown garden. The total plant diversity, flower abundance, trees, pollinators, nitrogen and phosphorus balance in urban gardens were compared across each management intensity.
Statistical analyses: Using star plot, I visualized the provision of ecosystem service bundles by each garden. Also, a comparison of nutrient balances of allotments, residential gardens, and gardens from other research was done.
Pearson correlation test was used to identify interactions among pairs of ecosystem service bundles. The correlation coefficient (r) was used to interpret the correlation results, while the P-value was used to interpret the statistical significance. Pearson coefficient; r ≤ +1 signified a positive correlation, r ≤ -1 signified a negative correlation, and Pearson coefficient; r =0 signified no correlation. Synergies are positive correlations, while tradeoffs are negative correlations. For statistical significance, the P value must be less than 0.05 (P< 0.05).
Lastly, the Likert package was used to compute percentages of all the cultural ESS. This was done to identify the most preferred service before and during the Covid period, as well as to compare the provision of cultural services before and during the Covid period.
R statistical software was used for all statistical analyses.