Animals and devices
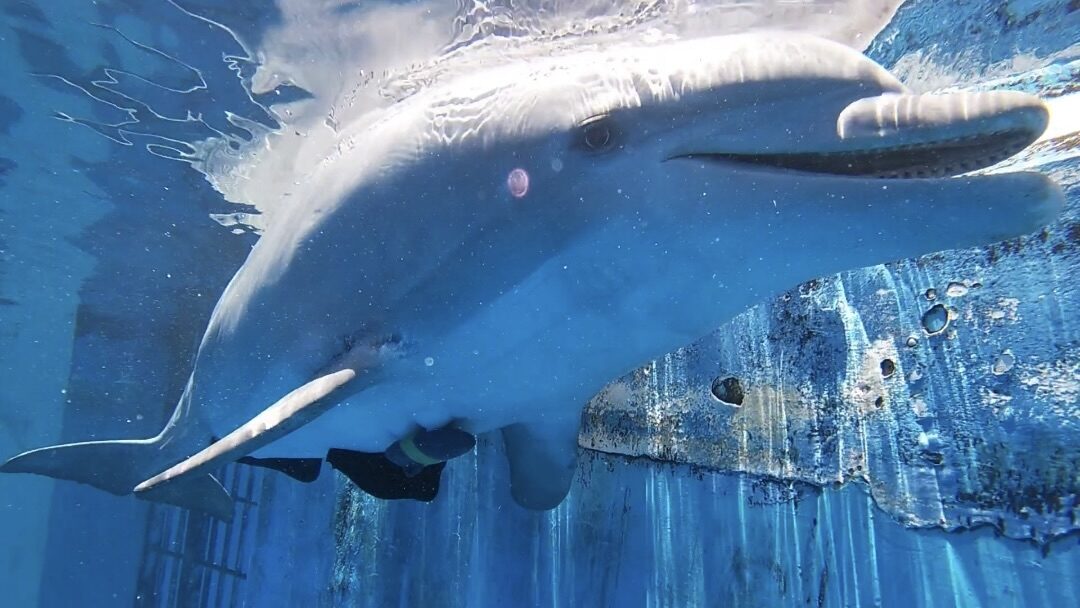
In this study, data were collected on seven (3 ♀ and 4 ♂) bottlenose dolphins (Tursiops truncatus) housed in managed care at the Oceanogràfic of Valencia, Spain. The animals ages ranged from 13 to about 35 years old.
The devices used were of three categories:
- One tag (M-tag) which recorded tri-axial acceleration along with other measurements.
- Two devices recording ECGs, either linked to a computer and cables (UFI, Powerlab system) or in another tag (Little Leonardo).
- One device that recorded both ECGs and tri-axial acceleration at the same time (MiniSub).
Procedure and experimental trials
As described in Aims, I investigated the BCG method through different steps.
Placement of the devices on the animal
First, I tried to search for the best placement of the acceleration sensor on the animal. To do so, the M-tag was deployed on the chest, and on the right and left flanks of the animals. Then, I looked at the general signal to noise ratio in the data and decided on which side of the animal I placed the devices for the experimental trials.
Best method to analyse BCG (one-dimension or three ?)
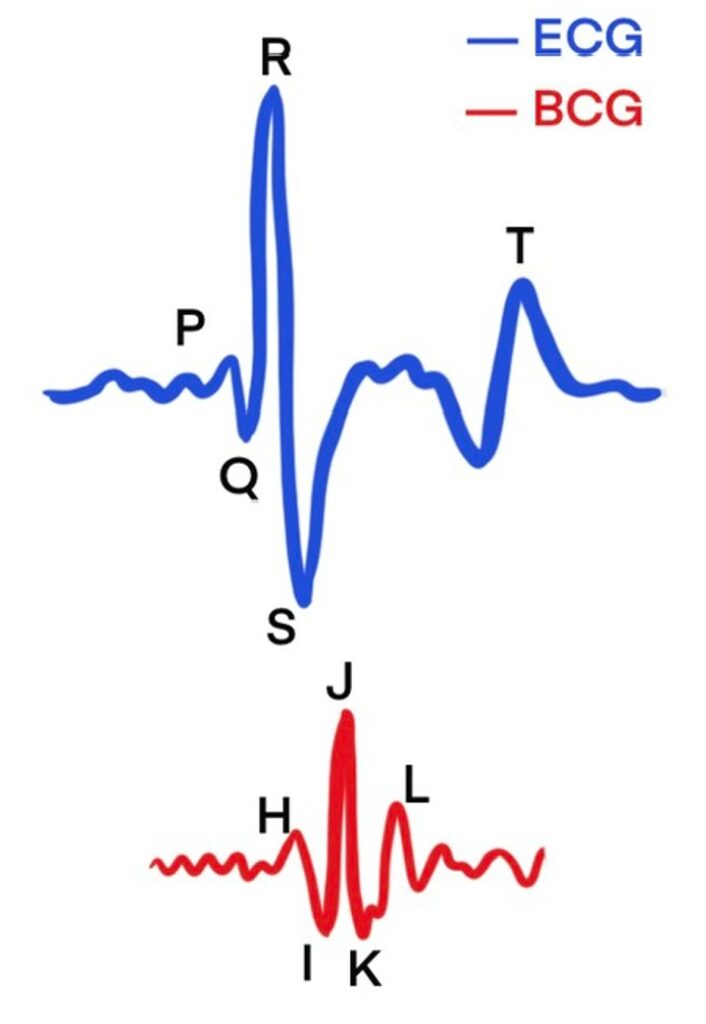
Then, before getting to the actual experimental trials, I tried to find the best method to analyse the BCG signals. This part being rather technical, I will not go too much into details. However, this consisted in testing the best correspondance between ECG and BCG using one-dimension (1D BCG, the x-axis of Figure 1) or three-dimensions (3D BCG). The 3D signal corresponds to the sum of the three-axis (x, y and z) of the BCG signal.
Data analysis
To investigate the comparison between the ECG and BCG methods, I looked at the instantaneous heart rate: the difference between the inter-beat intervals.
Using a peak detection software, I selected the peaks (R and J) in each signal (Figure 2). Those peaks corresponds to the contraction of the ventricles of the heart and are the most prominent.
After selecting the peaks, I exported the time in-between each peaks (the inter-beat intervals in seconds) to compare the two methods.
Experimental trials: the breath-hold experiment
The main goal of this study being to validate BCG as a proxy for measuring heart rate, I designed an experiment to gather ECG and BCG data while the dolphins were breathing and breath-holding.
The procedure consisted in:
- The dolphin coming voluntarily to the trainer and deploying the devices using succion cups.
- Recording pre-apnea heart rate when the dolphin was in a lign-up positions and breathing normally.
- Then, the dolphin started a 120 seconds apnea under the water, or shorter if the animal decided to emerge before.
- Finally, post-apnea heart rate was recorded when the dolphin was in a lign-up position alongside the trainer.
- All animals were reinforced during the procedure and after.