Part 1
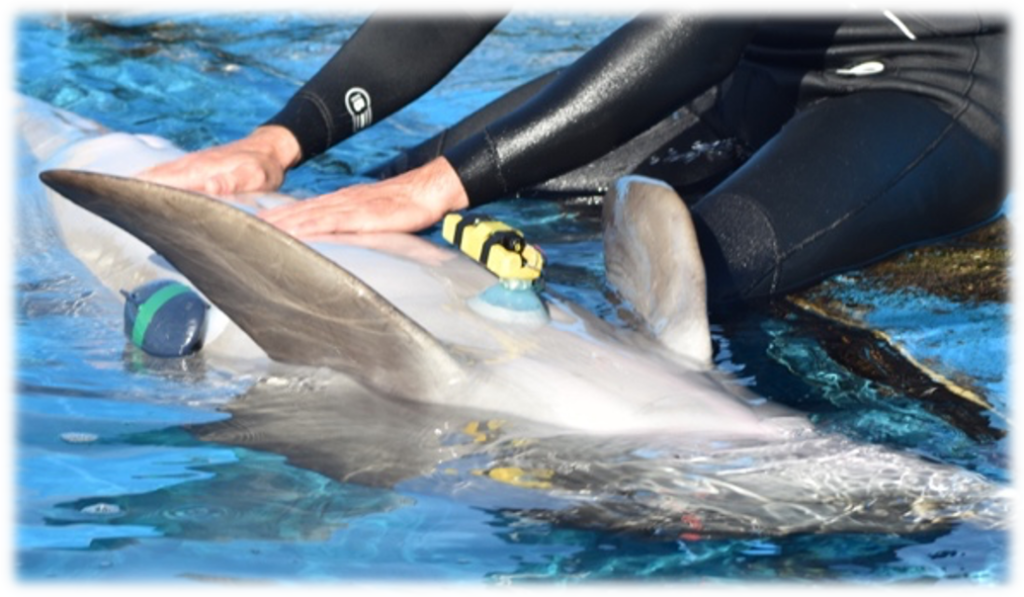
Location of the devices
Analysis of BCG: 1D VS 3D
By looking at the BCG signals obtained in the different locations (chest, right and left flanks), the signal obtained when the device was placed on the sternum was the clearest.
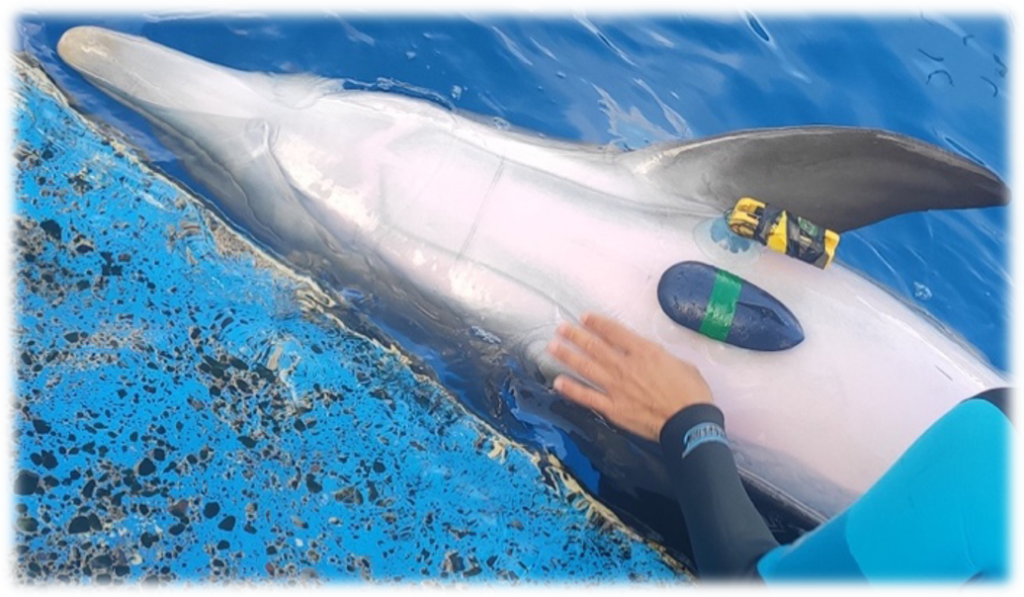
The signal to noise ratio was more important when the devices were placed on the flanks. Indeed, the movement of the pectoral fins and thoracic cage (breathing) created more noise in the signal.
Although the analysis here was only visual, I confirmed this precedent statement by trying the locations several times on different animals. Unfortunately, the data was not enough to perform any statistics.
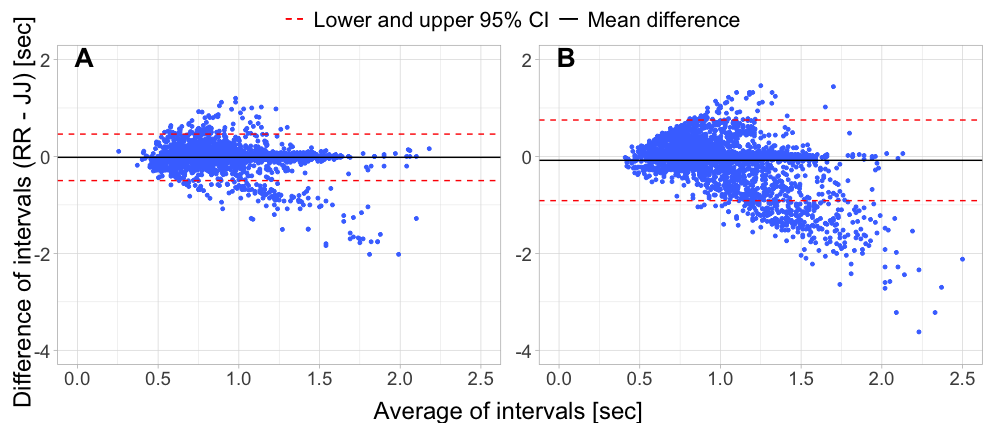
The 1D BCG method showed a better agreement between ECG and BCG intervals, the mean difference was -2% with a standard deviation of 24%.
For 3D BCG, the Bland-Altman plot showed less agreement between the intervals as the confidence intervals are larger than for 1D and I found points farther away from the mean difference between measurement. In 3D BCG the mean difference was -8% with a standard deviation of 42%.
Part 2
Validating BCG using ECG
The Breath-hold experiment
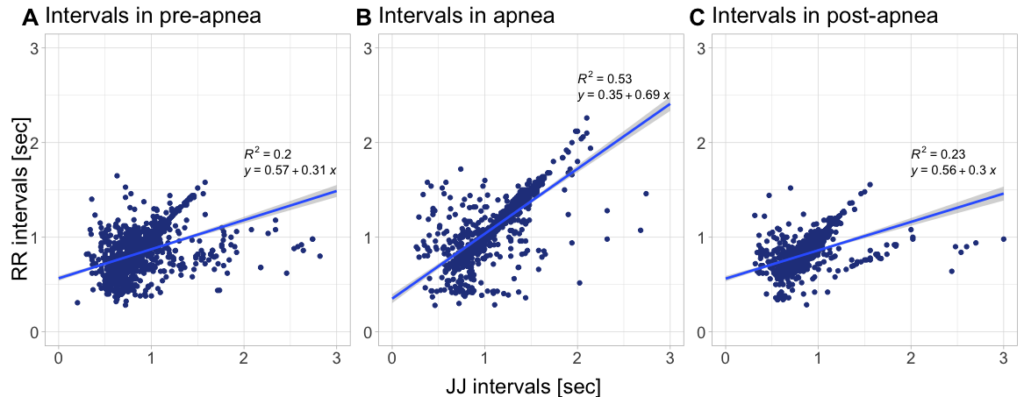
The inter-beat intervals of the two methods had a good agreement and were significantly positively correlated (Linear mixed-model, p<.001).
The same intervals yielded a better regression line (slope and intercept) in apnea (Figure 4-B) than pre-apnea and post-apnea (R2=0.53, R2=0.2 and R2=0.23, respectively).
The mean inter-beat intervals decreased between pre-apnea and the apnea, describing that heart rate was slowing down during the breath-hold (Table 1).
| Period | Mean R-R | Mean J-J | Mean Error |
| Pre-apnea | 0.830±0.005 | 0.861±0.007 | 0.163±0.007 |
| Apnea | 1.131±0.010 | 1.137±0.011 | 0.141±0.010 |
| Post-apnea | 0.808±0.005 | 0.820±0.008 | 0.139±0.008 |
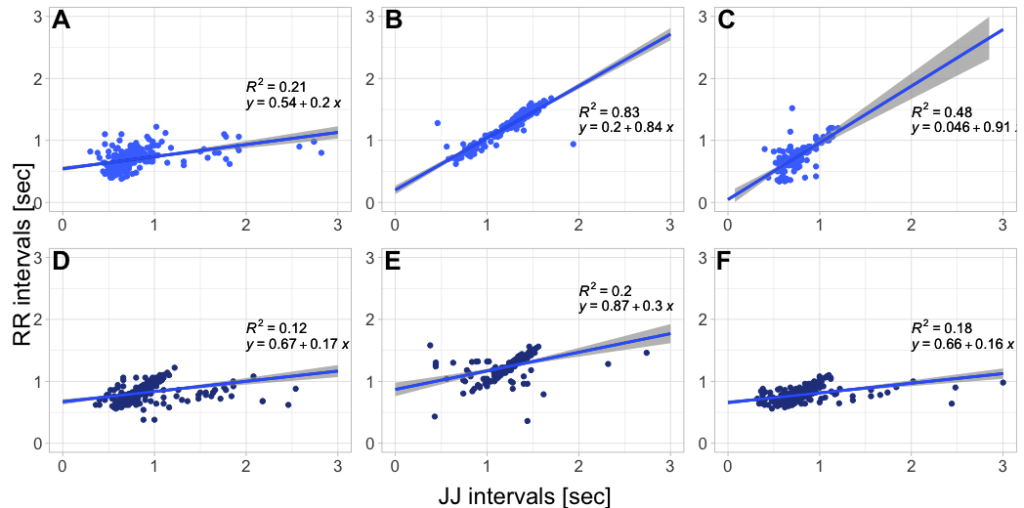
Animal differences
As seen in Figure 3, the correlation between ECG (RR intervals) and BCG (JJ intervals) gave a certain number of errors. This is because the correlation between the two was mainly dependant on the quality of the trials.
Meaning that since some animals moved more than others, the method could be worse for those animals than the others. As an example, Neptuno (Figure 5.A-B-C) had better regressions in all periods than Lazo (Figure 5.D-E-F). This is because Neptuno was one of the most desensitised animal but also one of the calmest as regard to research purposes.