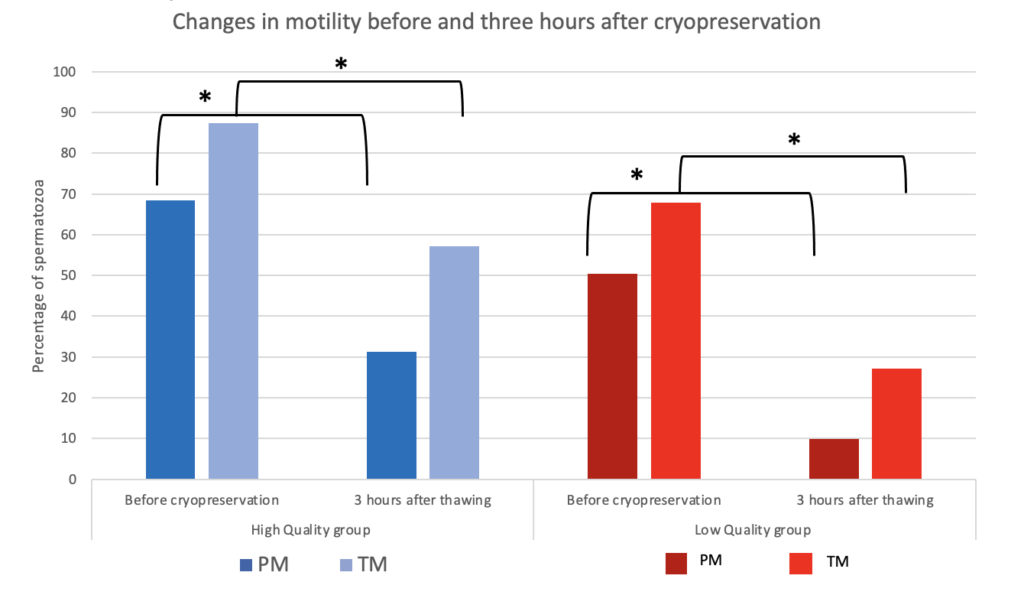
- Sperm motility: Using the CASA method to evaluate motility of spermatozoa, it was noted that all parameters studied showed significant differences between high and low quality groups. Seven out of eight motility parameters were significantly higher in the high quality group.
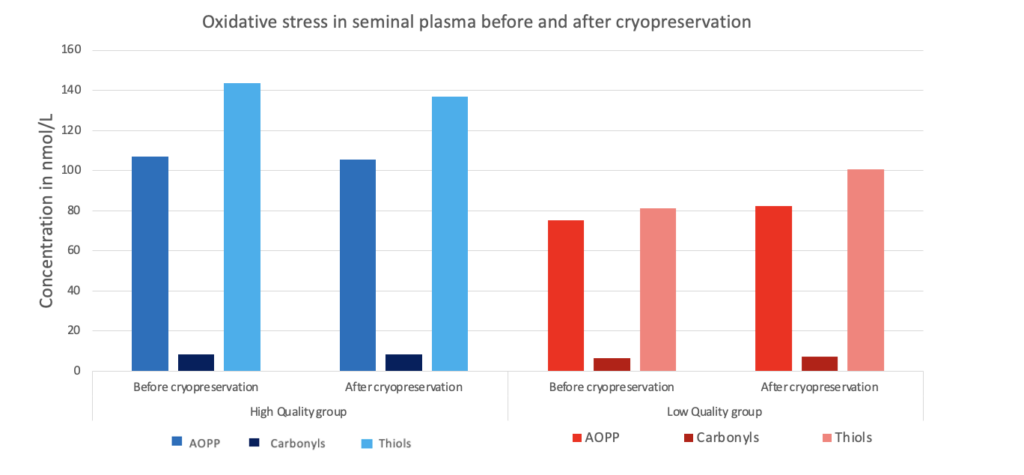
2. Oxidative stress status of seminal plasma: All measured oxidative stress parameters (AOPP, carbonyls) and antioxidants (thiols) were significantly higher (p<0.05) in the high quality group as compared to the low quality group, both before and after cryopreservation.
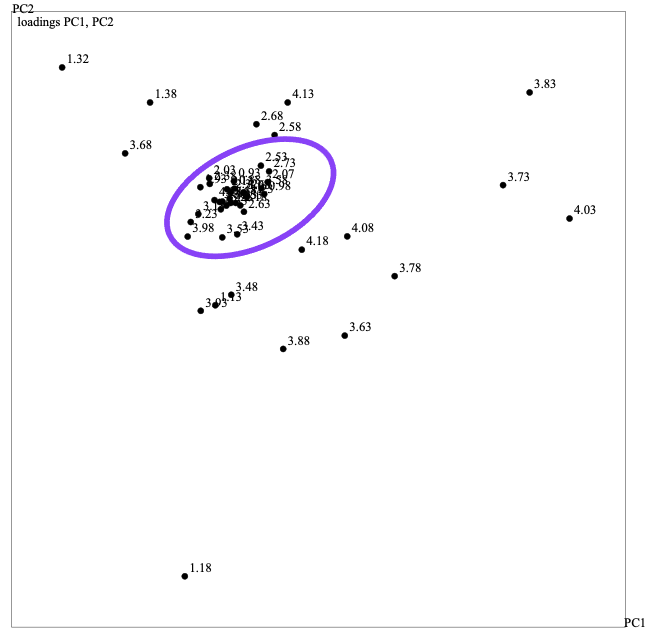
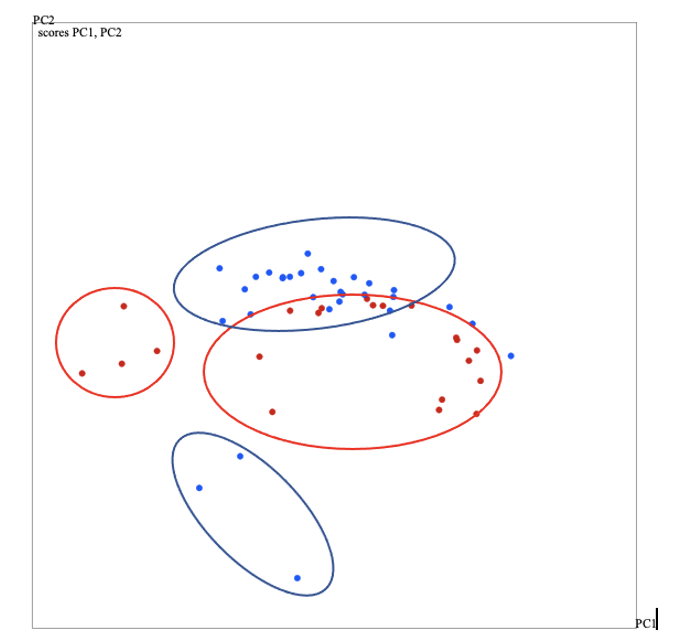
3. Metabolite composition of seminal plasma: The relationship between sperm motility and the ability to endure cryopreservation is related to the molecular composition of seminal plasma: the liquid environment that contains metabolites that are used and secreted by spermatozoa. By using NMR, the metabolomic profiles of 52 samples were obtained and assessed by PCA statistical analysis, yielding scores and loadings plots.
The scores plot showed clear clustering between high and low quality groups of ejaculates, further supporting the idea that semen quality is partly determined by metabolomic differences.
The loadings plot showed that there are about 18 metabolites (that remain unknown- that are furthest away from the purple cloud) that are responsible for the differences seen between high and low quality groups.