Gene count
Gene count metrics are part of the basic summary metrics from the 10x pipeline. Our samples contained 518, 772 and 1 205 median unique genes per cell and 15 757, 15 468 and 15 448 unique genes in total.
Ambient RNA
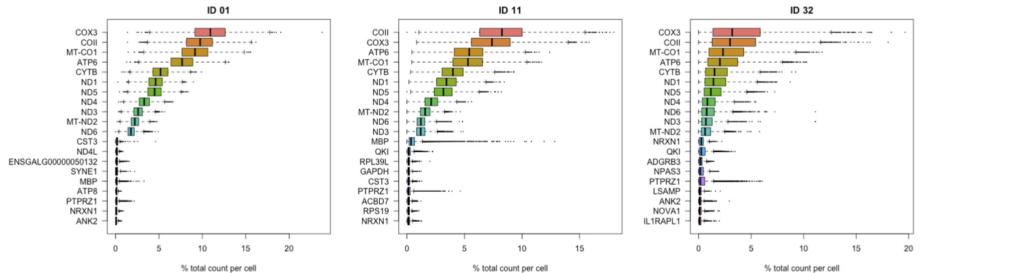
These boxplots show the top 20 genes present in the samples.
The top 20 is dominated by mitochondrial genes (MT-CO1, COII, COX3, CYTB, ATP6, ATP8, ND1, MT-ND2, ND3, ND4, ND5, ND6 and ND4L).
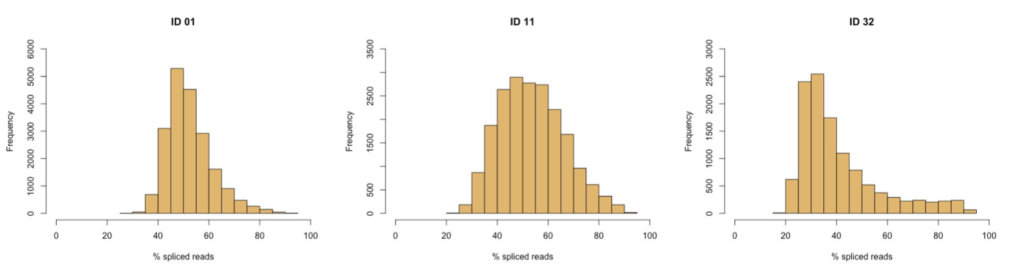
These histograms show the percentage of spliced reads. The sampled have rounded median of 51, 53 and 36, respectively.
Enrichment around the transcription start site
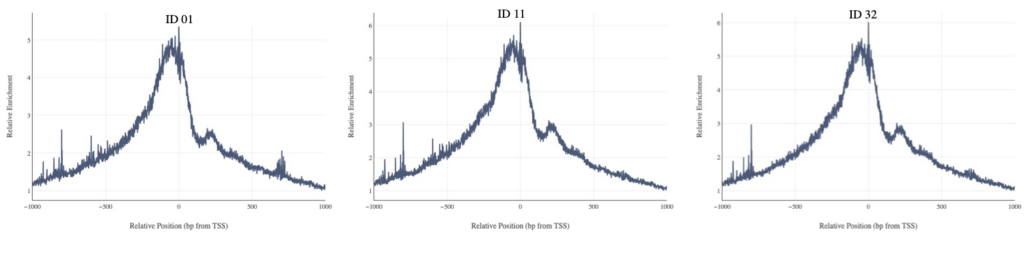
These plots show the relative accessibility of the area around transcription start site. Since promotor regions of active genes are expected to be in an open chromatin state, this region should have a higher accessibility. According to the ATAC standards of ENCODE, the peak value of this distribution must be higher than 5.
ATAC clusters
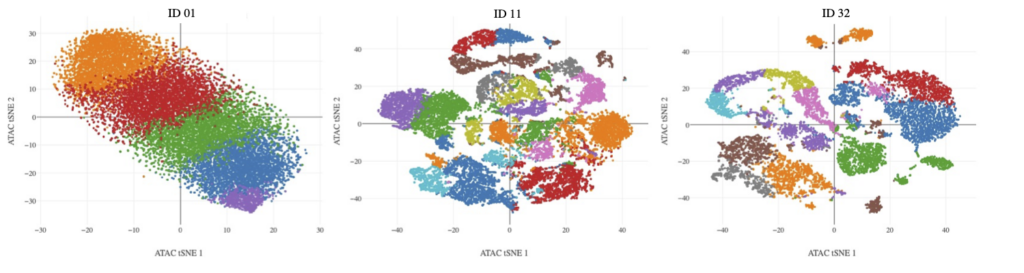
These plots show the clusters of possible cell types based on the ATAC data. The first sample seems to be compromised, but the other two show the desired traits for a heterogeneous cell population.