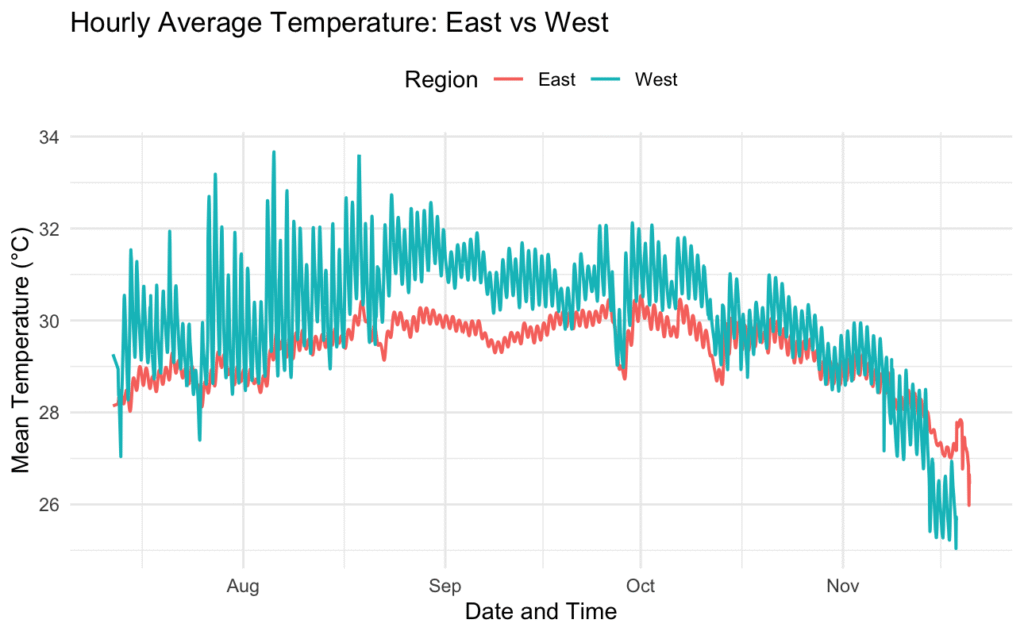
East vs West
West locations were on average 0.79ºC significantly warmer than Eastern beaches (p<0.0001). However, the effect size of the variance in temperature was quite small (6.7%).
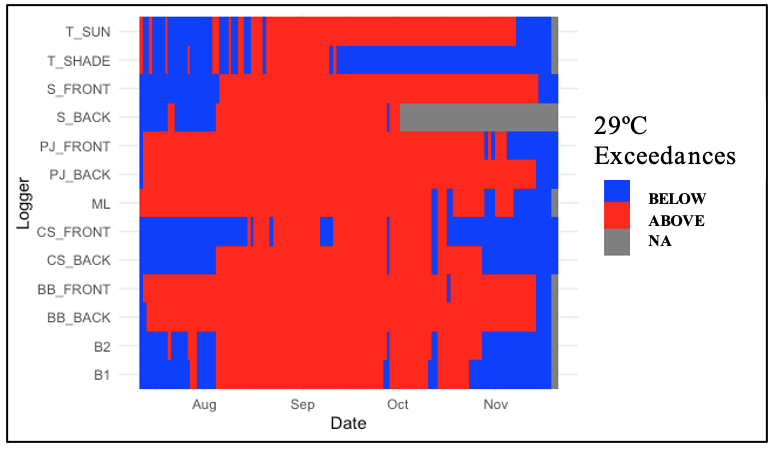
29ºC exceedances
More than two-thirds of the total days, across all locations combined, exceeded the 29ºC temperature threshold. September recorded the highest number of exceedance days (92%), followed by August (85%) and October (73%). As the nesting season progressed, most locations exhibited lower temperatures, with November being the coldest month.
Hatchery data
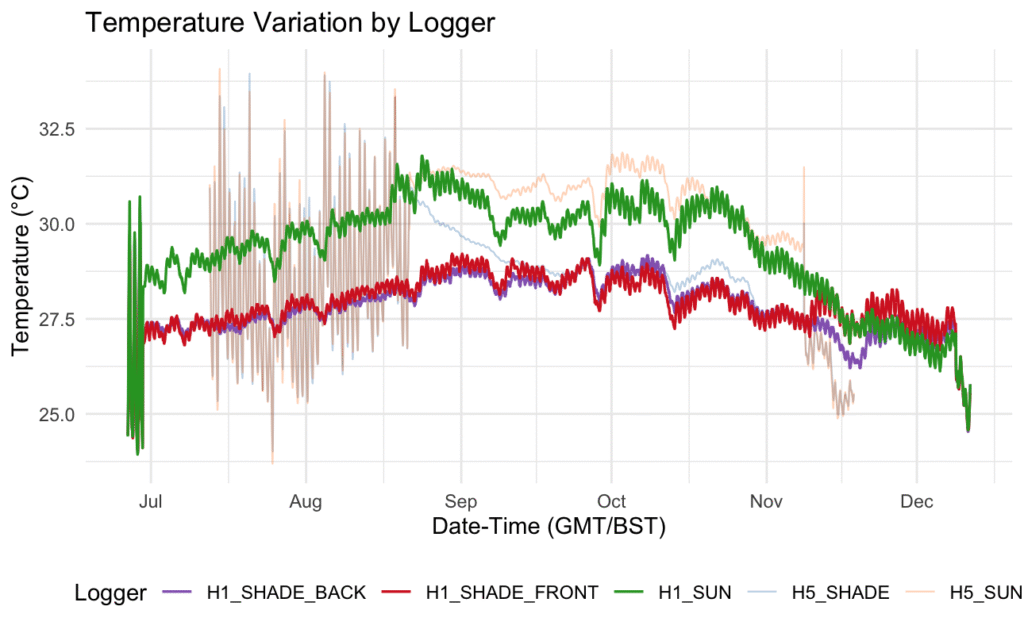
Hatch (81.6%) and nest (84.8%) success rates were both higher in shaded areas across both hatcheries (H1 and H5). Temperatures were consistently higher in unshaded areas, increasing until September before gradually decreasing. Similar trends were observed in the shaded areas.
Overall, sand temperatures in H5 were higher than in H1. Notably, significant temperature fluctuations occurred in both H5 loggers (H5_SHADE and H5_SUN) during the first half of the season.
Sand plots
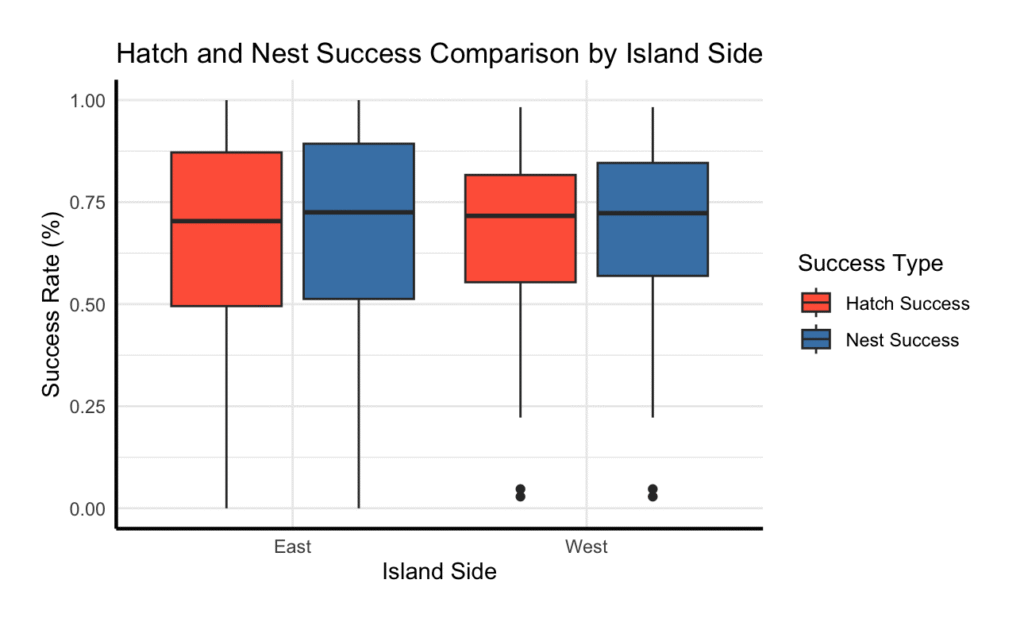
There was no significant difference in hatching success between wild nests located on the east and west sides of the island (p > 0.05), and the same was true for nest success rates (p > 0.05).
The mean hatch success was similar between the two regions, with 66.26% for the East and 67.15% for the West. Likewise, the mean nest success rates were almost identical: 68.41% for the East and 67.98% for the West.