This study did many different tests on the data in the construction of the binomial GLM models, but for the purposes of this webpage we need not go into all that much detail due to there being a clear trend in the data.
All models tested in this study, from the simplest that only looked at habitat area size to the Friction-Weighted Connectivity models, showed a significant positive correlation against all the different variations of Patch-Occupancy or number of unique individuals for The Marsh Fritillary in the study area. In other words, all explanatory variables looked at could explain the pattern seen in Filehajdar and Hajdhagen.
In the comparsion between the different connectivity models, it was found that the simpler Euclidean was stronger than most versions of the Friction-Weighted Distance connectivity models. This including the baseline friction model taken from another study. However, by optimizing the friction values for the lowest possible AIC value it was possible for the added complexity of matrix friction to better explain the Patch-Occupancy patterns or Number of Unique individuals of The Marsh Fritillary. The best of these models was called the “Found Model“.
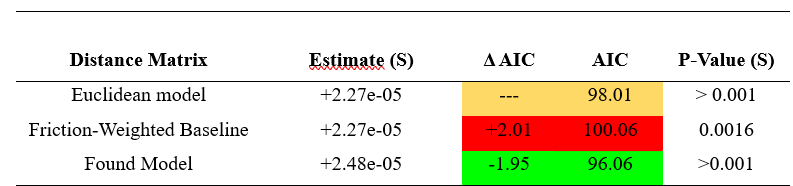
Worth noting is that the ΔAIC rarely exceeded 2 units in either direction, and the Found Model was not stronger than the Euclidean one in relation to unique individuals in each patch.
The ultimate difference between the baseline Friction-Weighted Distance model that was based upon the values an earlier study and the most optimal one can be seen below. Note that a friction value of 50 means that for every one metre a butterfly moves through that habitat, it costs the same as traversing 50 corresponding metres through their habitat.
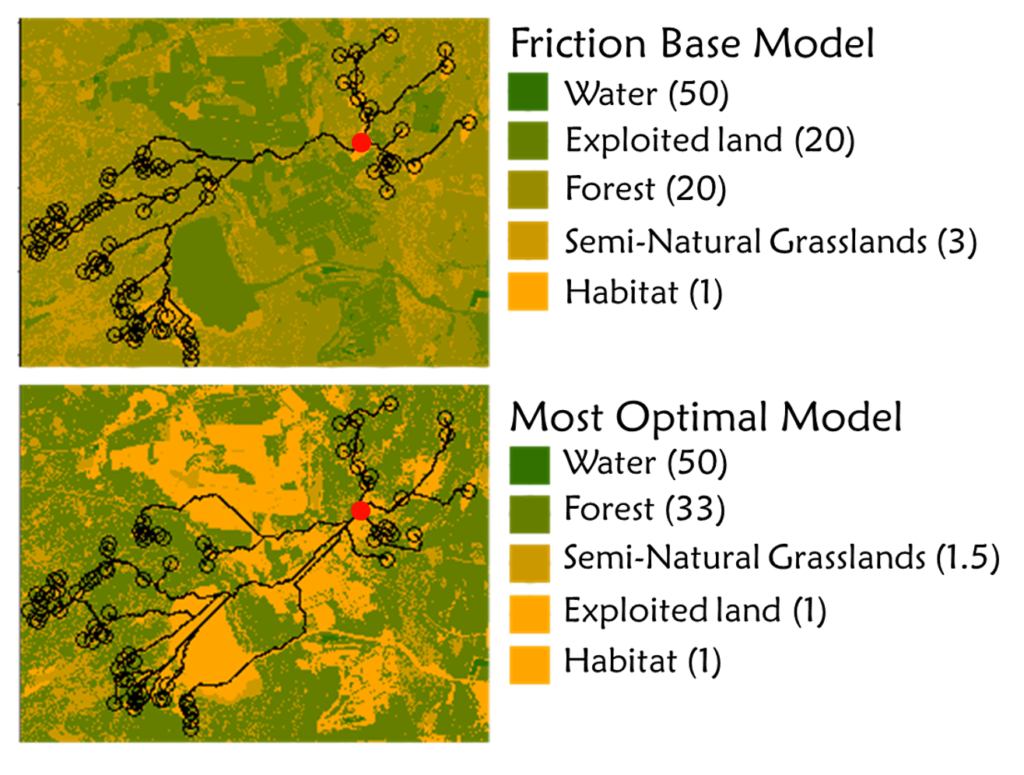
In short, the most optimal friction model assumes that exploited land is much easier to move through than the baseline would suggest and that forests are much harder to move through for the butterfly, with a slight change to non-habitat semi-natural grasslands.