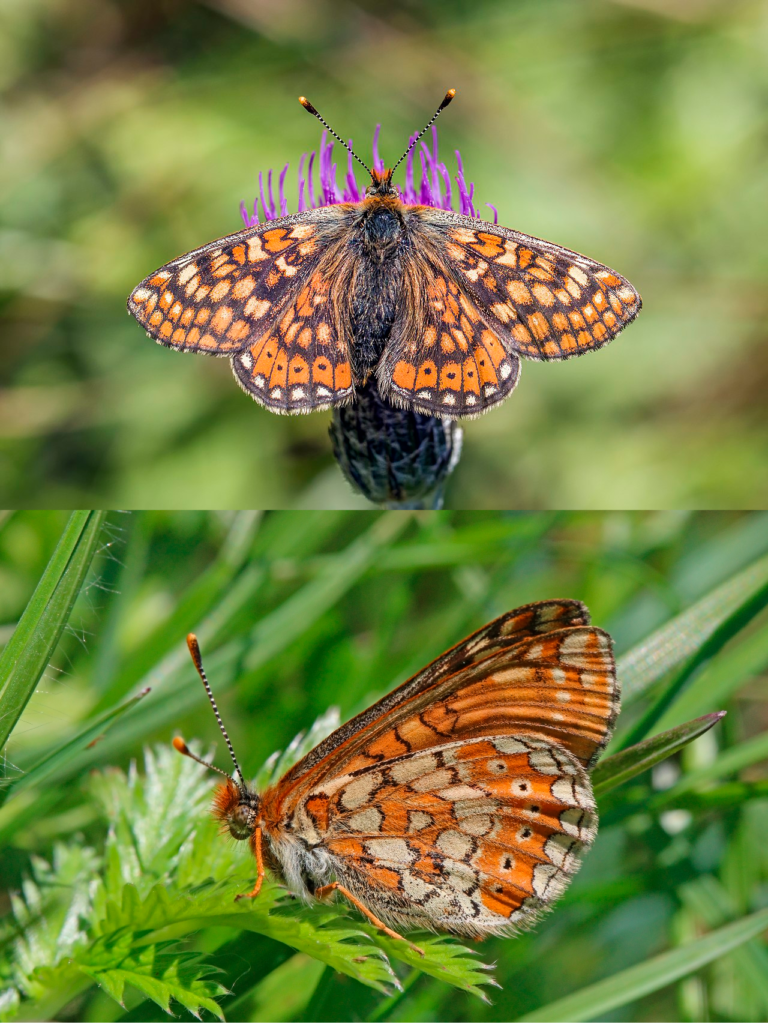
The study species in question for this study was The Marsh Fritillary (Euphydryas aurinia), a redlisted (vulnerable status) butterfly species that is dependent on marshy semi-natural grasslands that contains the host species devil’s-bit scabious (Succisa pratensis). It is one of the species protected under the Bern-Convention of 2018. It is a species in need of conserative action and was therefore chosen in order for this study to add to the knowledge around this species outside of the main aim of this study. Additionally, since the species is an airborne one, it is interesting to see if matrix friction would affect it or if it falls better within the simpler Euclidean Distance model.
Dorsal Image: By Charles J. Sharp – Own work, from Sharp Photography, sharpphotography, CC BY-SA 4.0, https://commons.wikimedia.org/w/index.php?curid=59385555
Side-View Image: By Charles J. Sharp – Own work, from Sharp Photography, sharpphotography, CC BY-SA 4.0, https://commons.wikimedia.org/w/index.php?curid=59385554
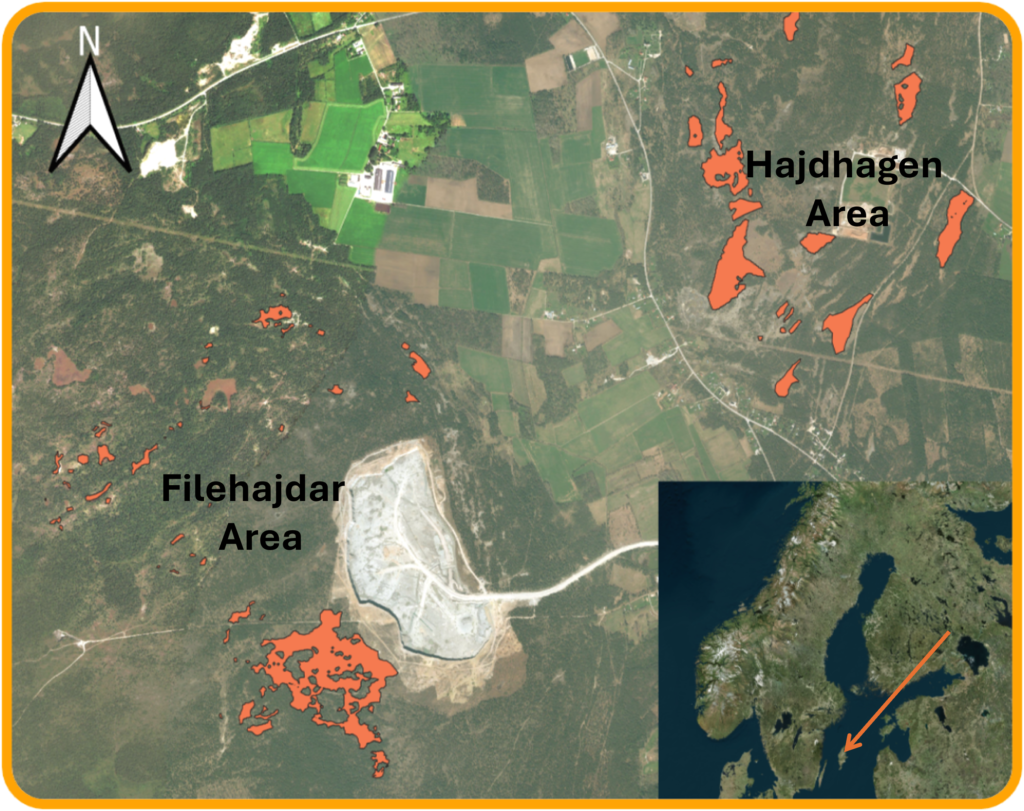
The field work of the thesis was done in collaboration with the company Calluna in the habitats of Filehajdar, Hajdhagen, and their respective satellite areas on Gotland, Sweden. The marked areas on the map are 81 hectares of habitat consisting of calcareous semi-natural and marshy grasslands. There is a large streak of exploited land in between the two areas, agricultual land and a large lime-stone quarry more specifically, separating the two core areas from one another.
Data Collection
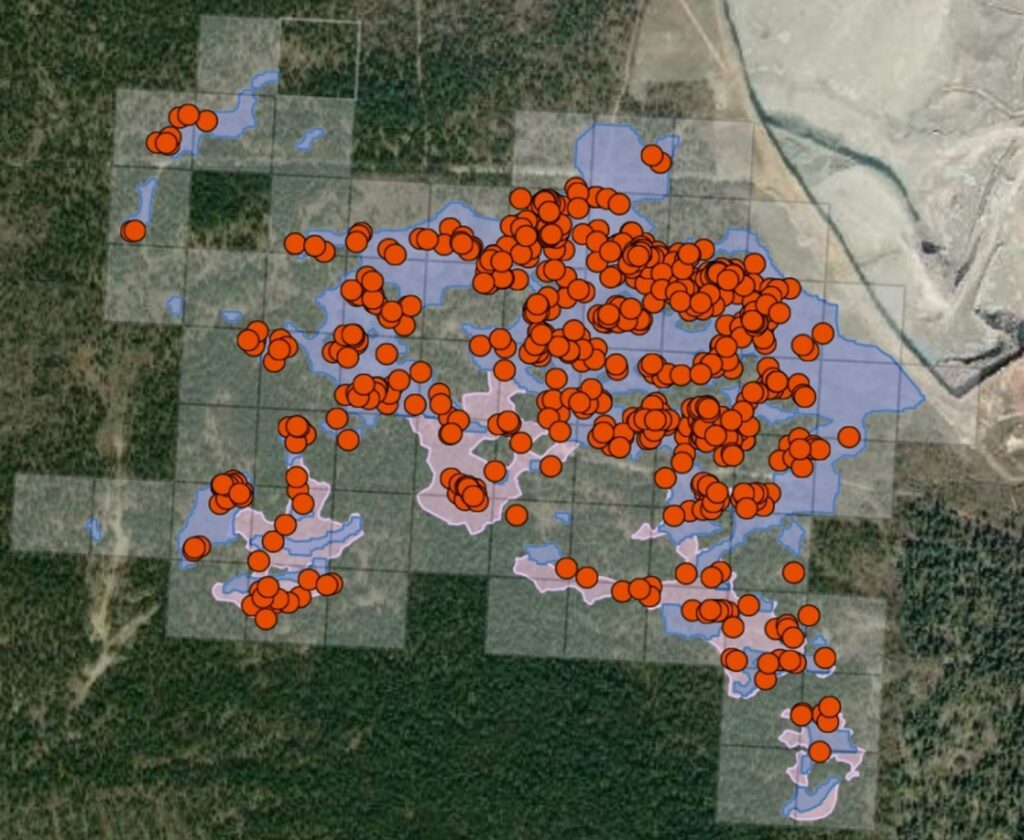
Using a Capture-Mark-Recapture (CMR) method during the flying season of The Marsh Fritillary (lasting from the 25th of May to 25th of June this particular year), butterfly movements were logged throughout all the different patches of the study areas.
Butterflies were caught with nets and their position where they first were spotted alongside whether they were marked or not was recorded. If a butterfly was not marked, it was given a letter and number designtation (Letter for person who captured it, number for which number of butterfly it was that person had captured. A1 for example) by marking both its wings with an odorless marker. Each area was combed for the butterflies daily when the weather allowed it (winds below 8 m/s and no rain). If the same individual was captured repeatedly by the same person, it was not recorded unless that same person found it at least a kilometre or so away from the area it first had been caught to avoid oversaturation.
This method allows one to see which areas are occupied by The Marsh Fritillary, which patches are most heavily frequented, and how recaptured butterflies move throughout the areas.
Statistical Analysis
The CMR butterfly data was structured so that butterfly patch-occupancy, interpatch movements (dispersals between patches), and the number of unique individuals in each patch was recorded. During the later stage analysis, only interpatch movements that fell within a buffer zone of 10 metres around the patches was accounted.
This data was then used to create binomial general-linear models (GLM) that sees if the patterns of patch occupancy could be explained by either habitat area size, Euclidean Connectivity between the patches, or the Friction-Weighted distance when accounting for matrix friction. Furthermore, different versions of the same models were tested where you excluded all patches where no butterflies were found or instead of patch occupancy related the explanatory variable to the number of unique individuals inside each patch.
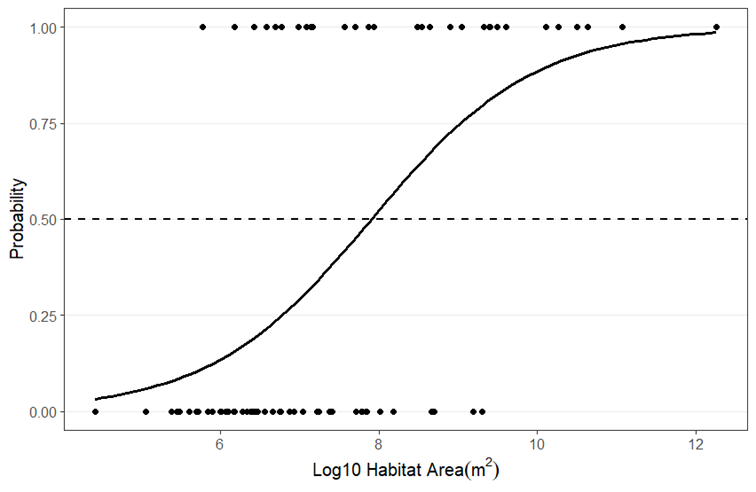
After having analysed each type of model, using another study’s friction values (how hard it is to move throughout a certain terrain for the species), the models where then compared to eachother to show which one had the best relative strength in explaining the occupancy patters of The Marsh Fritillary (Comparing AIC values). In this step, the models had to be simplified to calculate distances from the midpoints of each habitat patch rather from the actually closest edge to edge distances of the patches. This was due to the immense computational strain on the available hardware making it so the computer couldn’t actually compute the more realistic model using the full polypon shapes of each habitat.
Finally, a Found Model trying to optimize the friction values in the search for the lowest possible AIC value was created in order to see how much different values of friction could strengthen the model in relation to the other models. If at all.