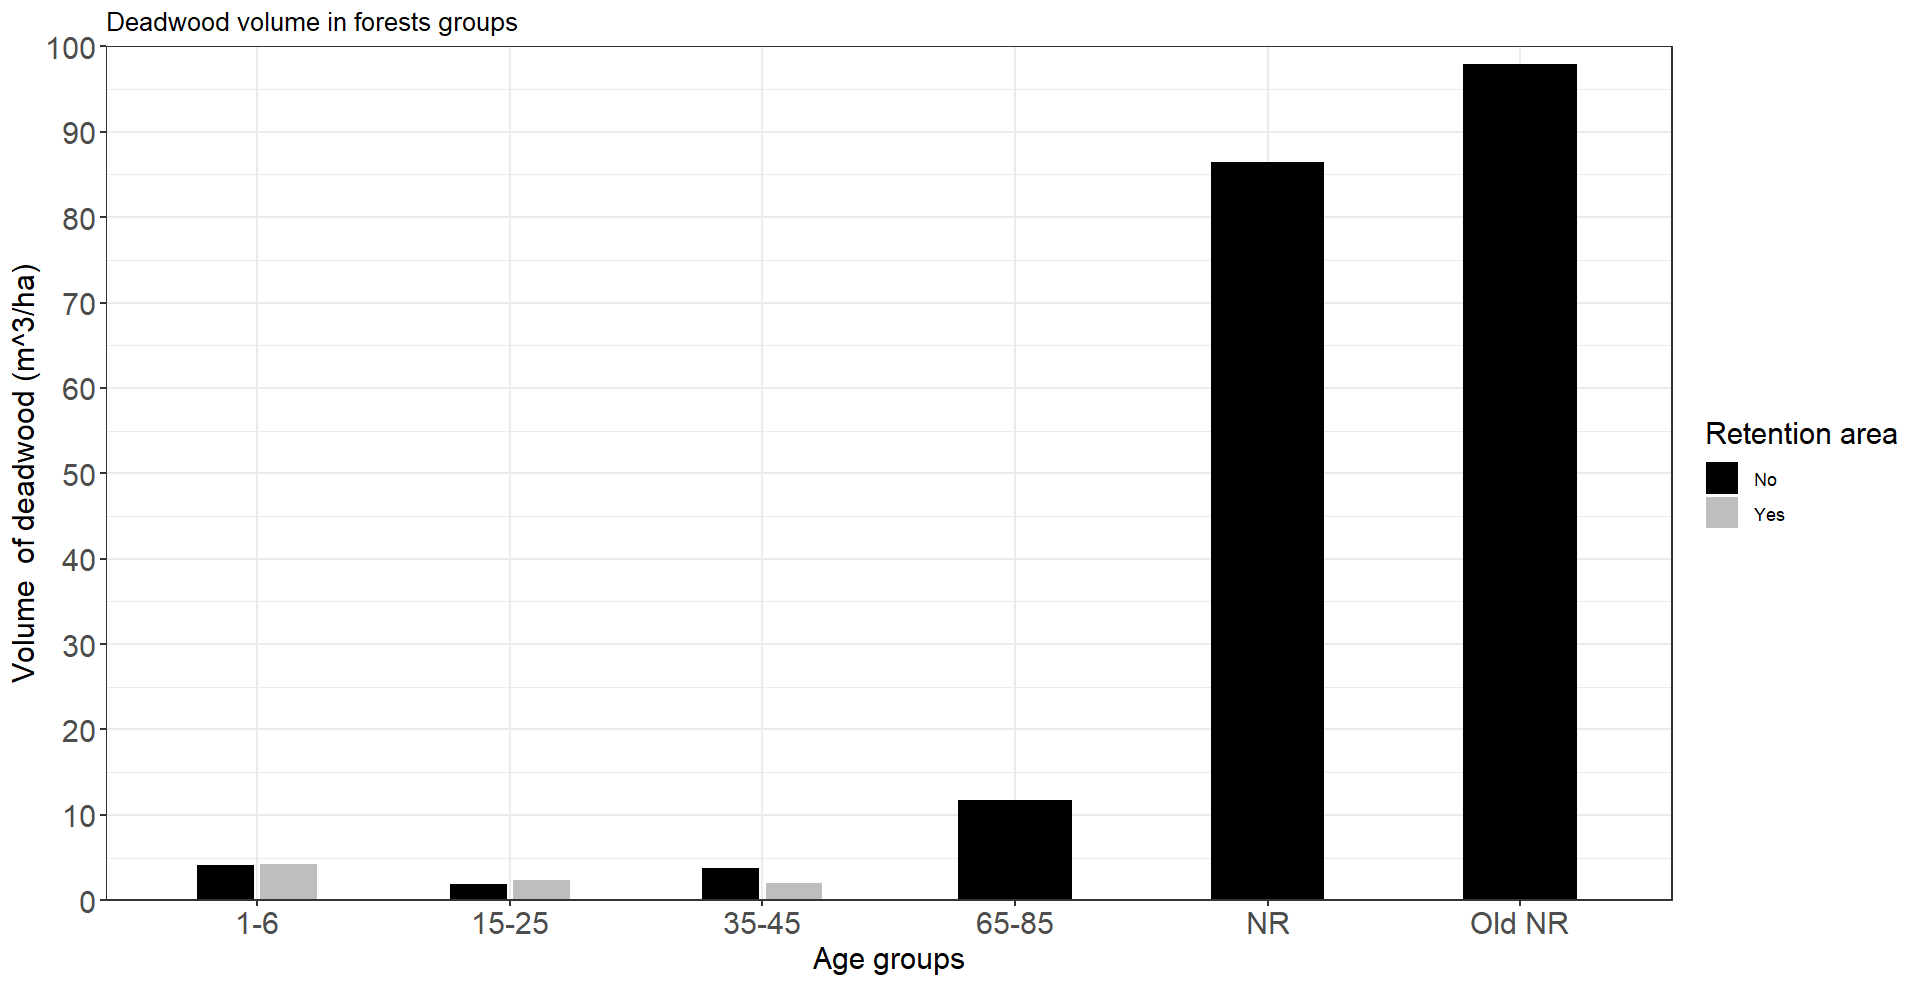
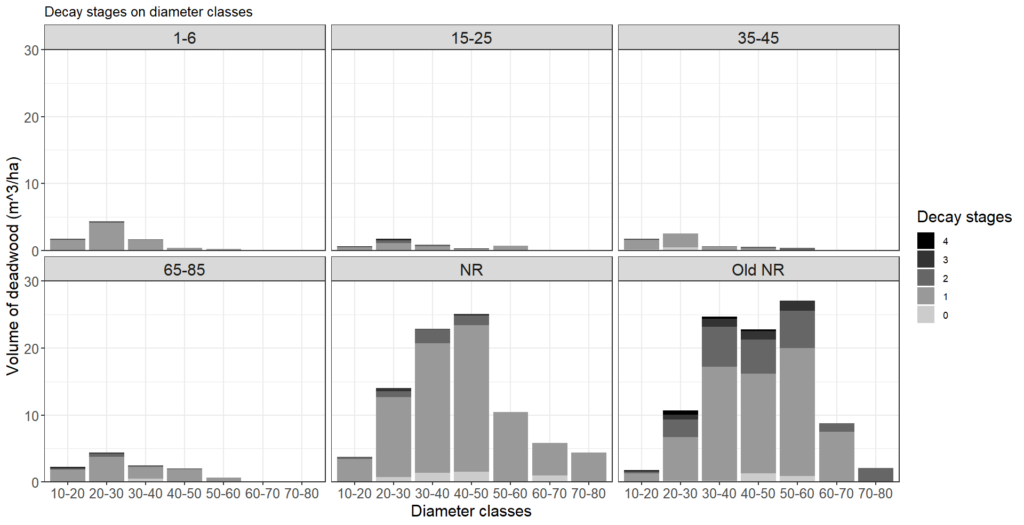
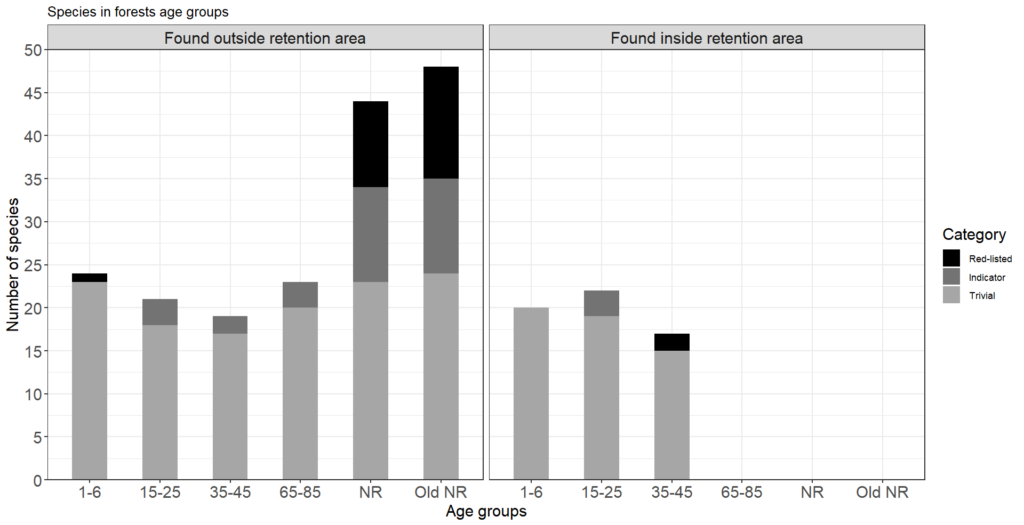
The results showed that nature reserves had higher volumes of deadwood (Figure 1.) As well as higher variation of diameter classes and decay stages of the deadwood comapred to the production forests (Figure 2.). Nature reserves also had more observations of indicator species and red-listed species comapred to production forests (Figure 3.). The retention areas did not differ from the rest of the production forests in regard of deadwood volume or species observations.
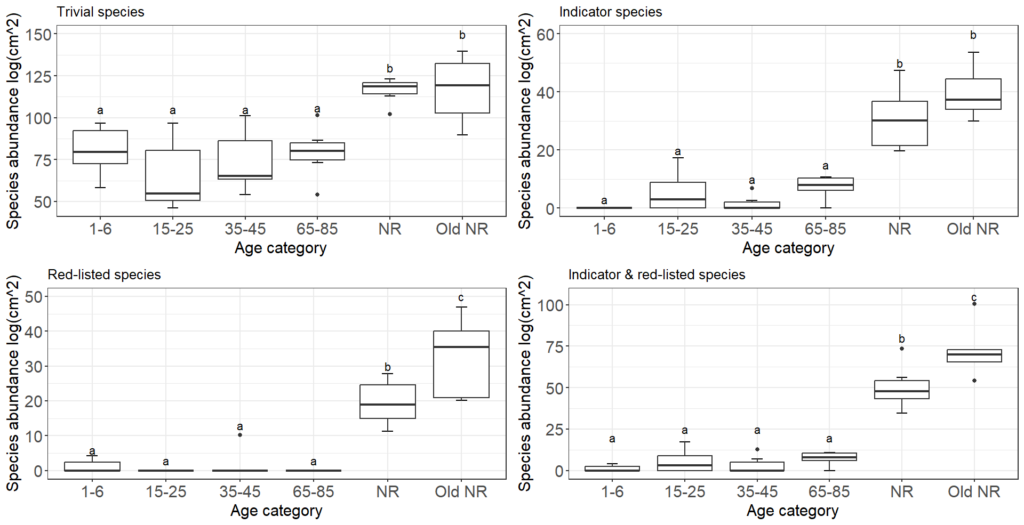
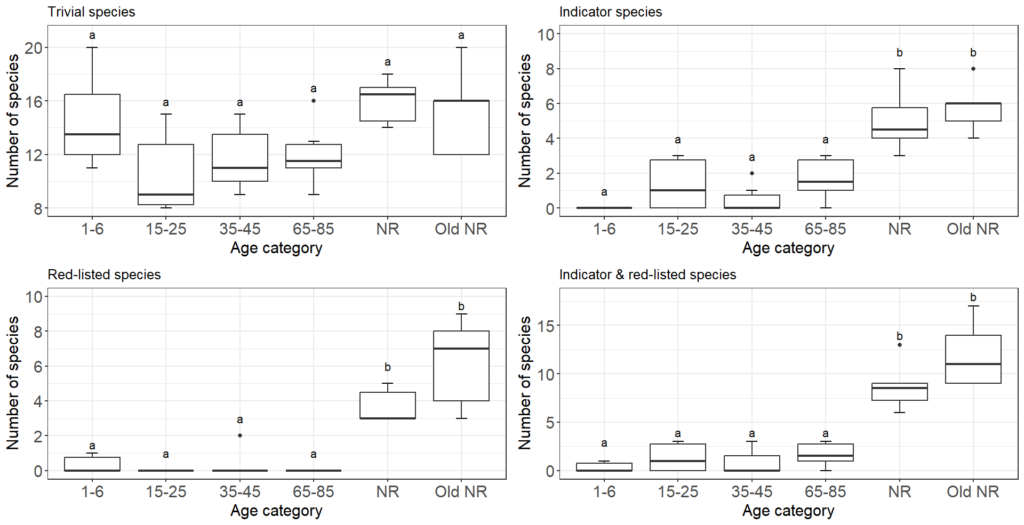
With GLM and pairwise comparison it was shown that nature reserves often had a significant difference compared to production forests regarding species abundance and species richness (Figure 4;Figure 5). It was only for trivial species richness where no signficant difference could be found between the production forests and the nature reserves.
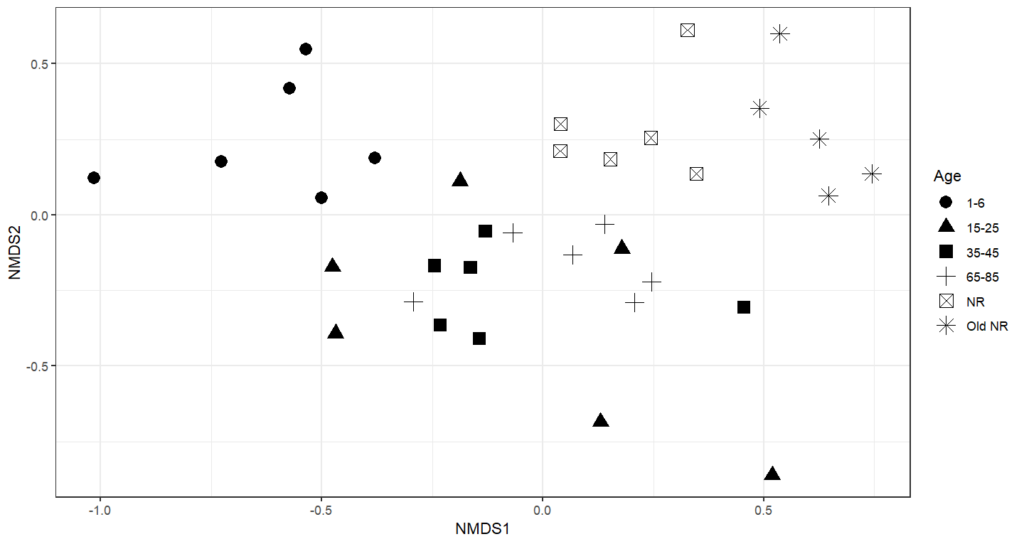
The species composition was significantly explained by forest age category (R2= 0.51, p <0.001). The composition in nature reserves were separated from production forests (Figure 6.) and separated from each other based on pair-wise tests. Within production forests, clear-cuts stand out, while remaining categories were more intermixed.