Weight
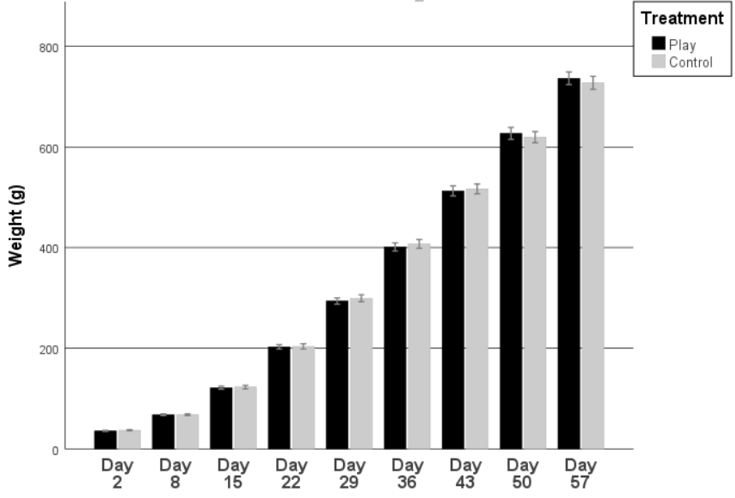
No significant differences were found between play groups and control groups in the 9 weeks of testing. (t < -0.199 ; p -Value > 0.231 in all cases)
HANDLING SCORES
Insufficient data was collected to conduct any statistical tests at the group level. Low sample sizes and lack of data at the individual level also did not provide conclusive results.
SOCIAL REINSTATEMENT
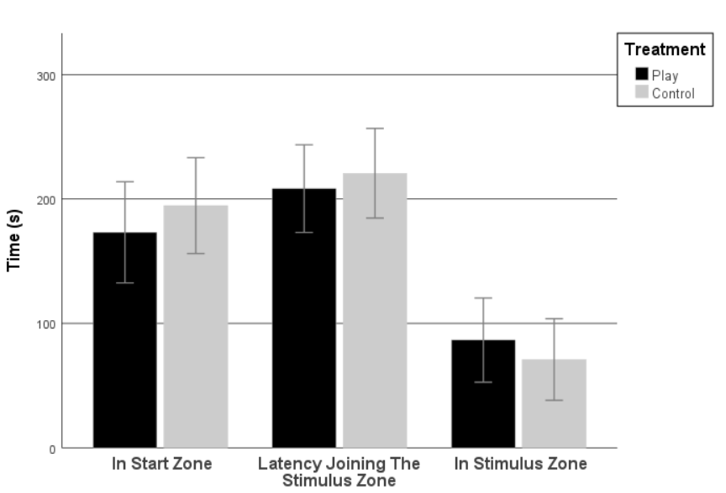
There were no significant differences between plays groups and control groups in time spent in the start zone (t =- 0.783; p = 0.437), latency to join the stimuli zone (t = 0.675; p = 0.502), and time spent in the stimuli zone (t =-0.502; p = 0.618)
COGNITIVE JUDGEMENT BIAS
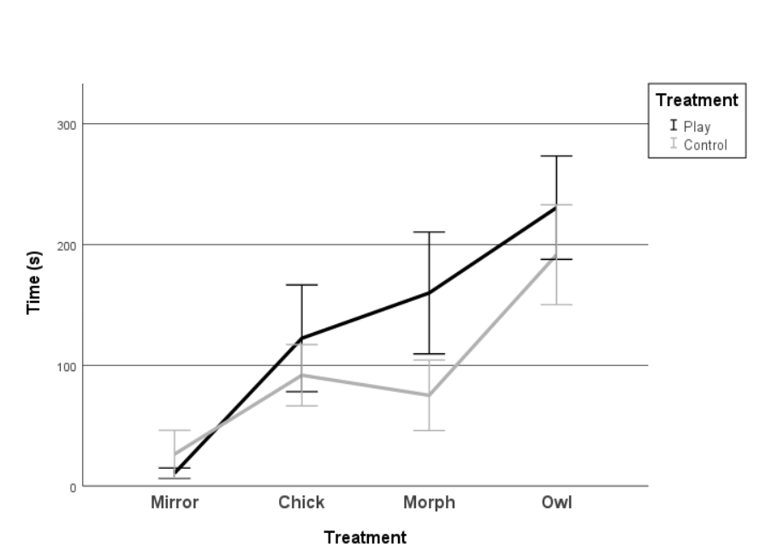
There was a significative difference between CG and PG (F = 8.082; df = 1; p = 0.005) in the latency to reach the goal line in the cognitive judgment bias test and between each stimulus (F = 68.650; df = 3; p < 0.001). CG chicks were faster than PG chicks when crossing the chick, morph, and owl stimuli (Figure 9). There was also a significative difference in the interaction between the Treatment (PG/CG) x Stimuli. (F = 4.859; df = 3; p = 0.003).
NOVEL ARENA AND NOVEL OBJECT
Novel Arena
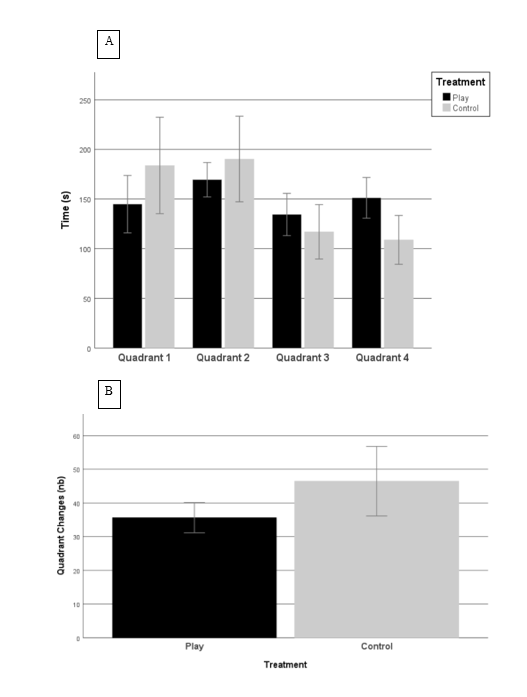
There were no significant differences between play groups and control groups in the time spent in quadrant 1 (t= -1,411; p = 0.164), 2 (t= -0,917; p = 0.363) and 3 (t= 1,028; p = 0.308). However, play chicks spent more time in quadrant 4 than control chicks (t= 2,704; p = 0.009). Also, There was a tendency for control chicks to cross more quadrants than play chicks (t= -1,970; p = 0.054)
NOVEL OBJECT
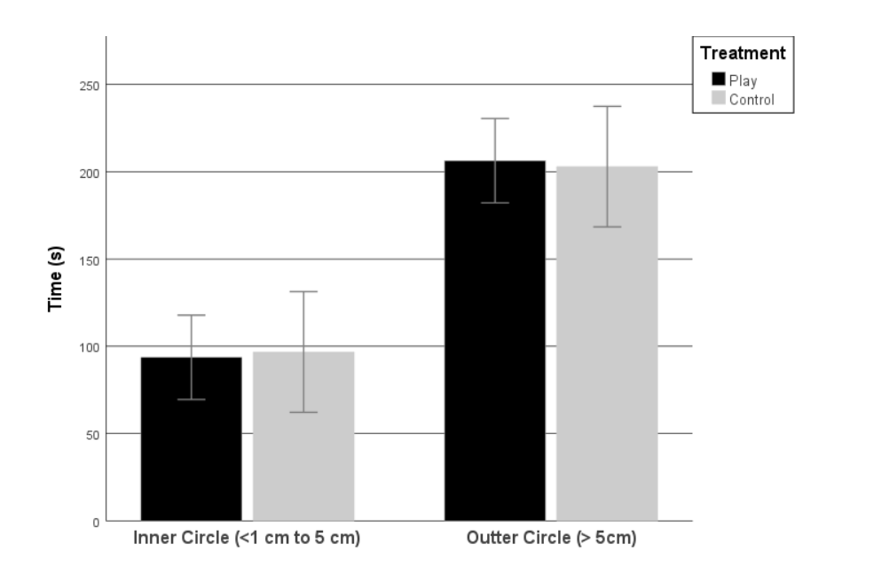
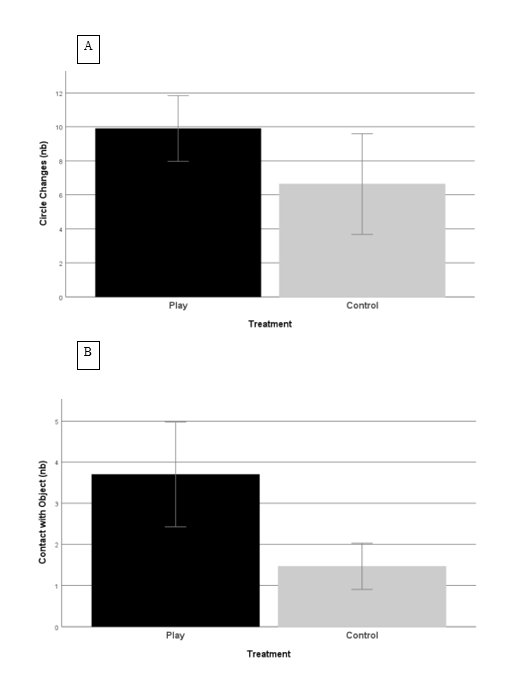
There were no significant differences in the time spent in the inner ( t = -0,149; p = 0.882) and outer (t = 0,165; p = 0.870) circles. A tendency for play chicks to change circles more often than control chicks ( t = 1,890; p = 0.064) can be considered. Contacts with objects are more frequent for play chicks (t = 3,286; p < 0.001).
TONIC IMMOBILITY
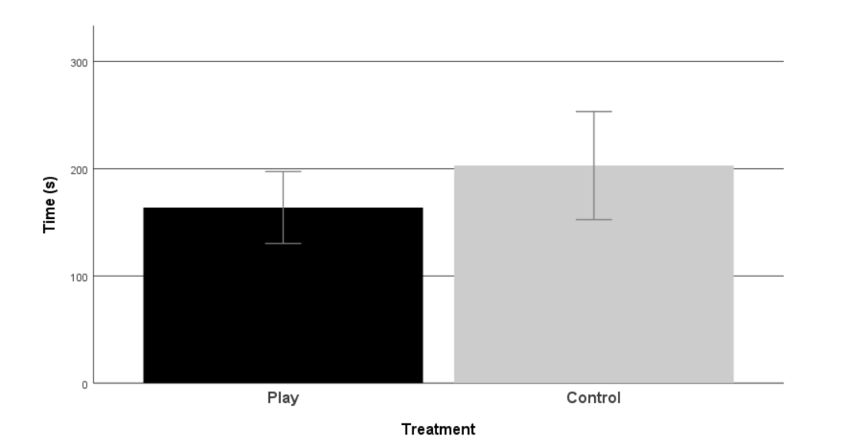
There are no significant differences in the latency to exit tonic immobility between play chicks and control chicks (t = -1.333; p = 0.188)
RESTRAINT TEST AND BLOOD SAMPLING FOR CORTICOSTERONE ANALYSIS
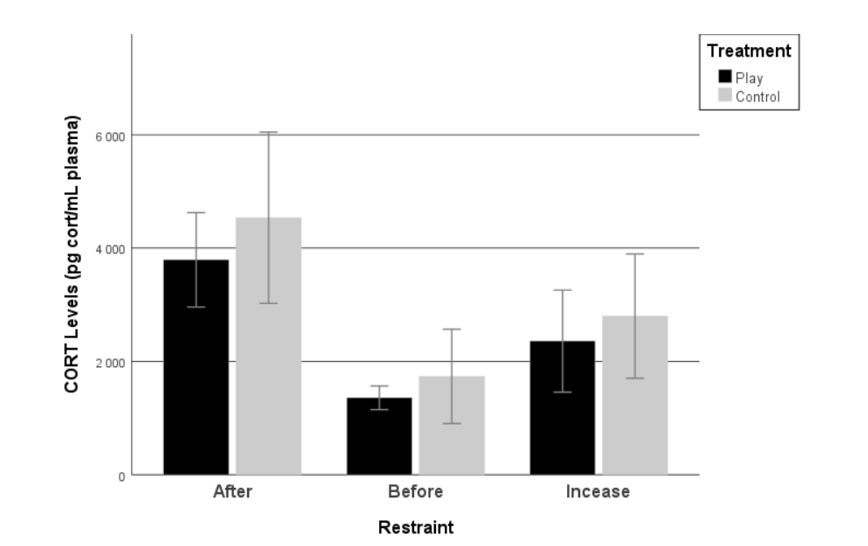
The test worked as intended as corticosterone values before and after restraint were significant (Wχ2 = 30.641 ; df = 1 ; p = <0.001). However, there was no significative difference in the levels of corticosterone before (Wχ2 = 0.789 ; df = 1 ; p = 0.374) and after (Wχ2 = 0.772 ; df = 1 ; p = 0.379) restraint between play chicks and control chicks. Treatment (Play/Control) did not affect corticosterone increases (Wχ2 = 0.407 ; df = 1 ; p = 0.523) and there was no significant interaction between restraint and treatments (Wχ2 = 0.149; df = 1; p = 0.699). In addition, we can see that control chicks had a higher baseline (21.75%) after restraint (16.37%) and increase (15,78%) corticosterone values than play chicks, although not significant (all t <-0.639; p > 0.387)
