Taste preference thresholds
Relative sweetness
Food-associated carbohydrates
The taste preference thresholds scored by the four white-faced sakis were found to be (Fig. 1):
- Sucrose: 10 mM
- Fructose: 10-40 mM
- Glucose: 20-30 mM
- Maltose: 20-30 mM
- Lactose: 30-40mM
The interindividual variation in taste preference threshold scores for sucrose was the lower among the five food-associated carbohydrates, with all for animals scoring the same preference threshold value. The interindividual variation for a given substance between the most- and least-responsive individual was only a factor of 1.33 for lactose, a factor of 1.5 for glucose and maltose, and a factor of 4 for fructose.
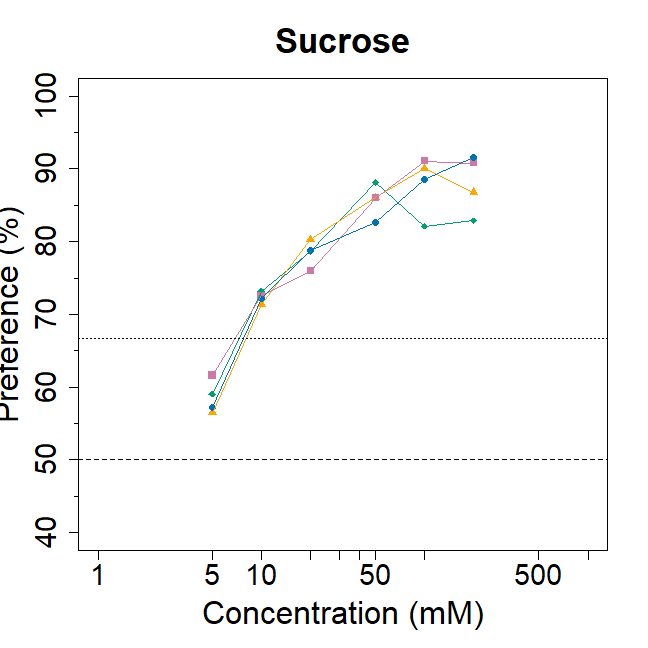
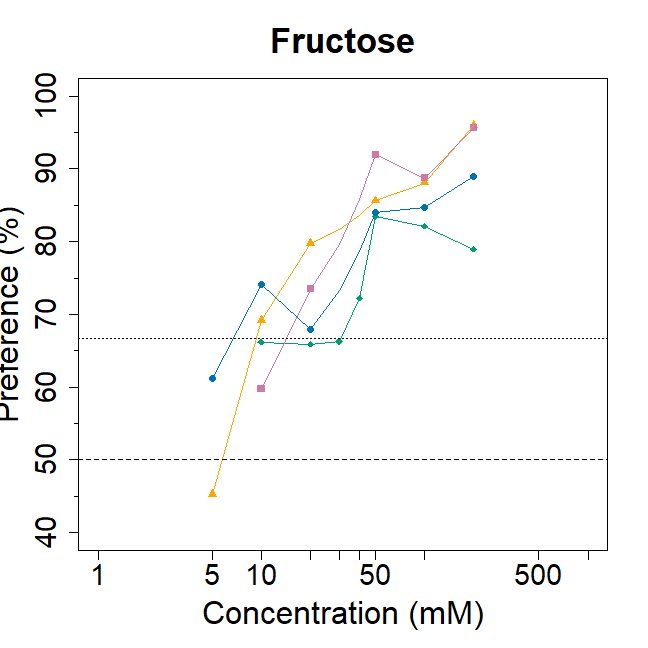
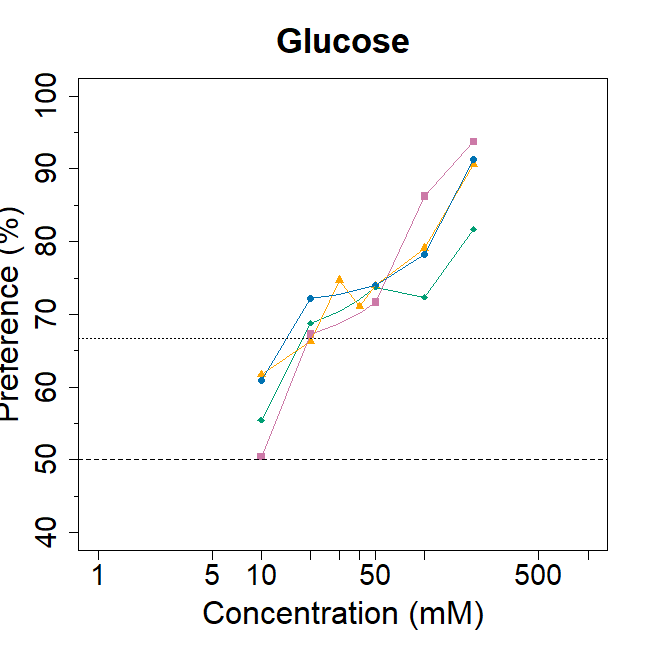
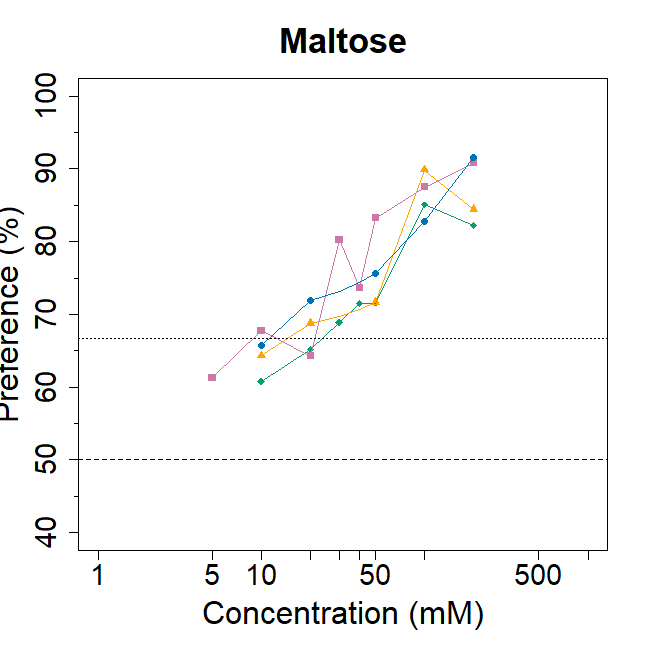
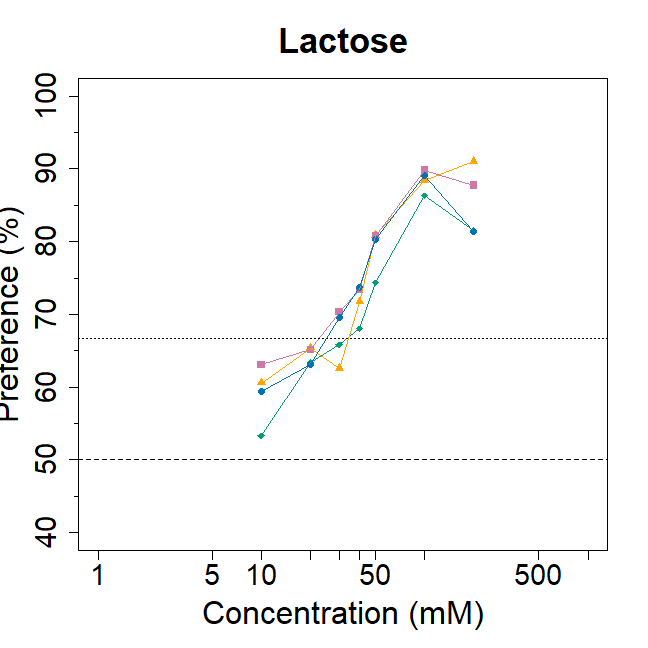
Figure 1. Taste preferences of four white-faced sakis for taste solutions of sucrose, fructose, glucose, and lactose tested against tap water. Each data point corresponds to the mean value calculated from the 10 trials of 2 minutes performed per individual. The preference criterion and chance level are represented by the dashed lines.
Steviol glycosides
The taste preference thresholds scored by the four white-faced sakis were found to be (Fig. 2):
- Rebaudioside A: 0.04 mM
- Stevioside: 0.2-0.5 mM
Preference thresholds for rebaudioside A showed the lower degree of interindividual variability among the two tested steviol glycosides, with all four animals scoring a threshold value of 0.04 mM. In contrast, preference thresholds for stevioside showed a higher degree of interindividual variability between the most- and least-responsive individual with all four animals scoring a different threshold value (0.2, 0.3, 0.4, 0.5).
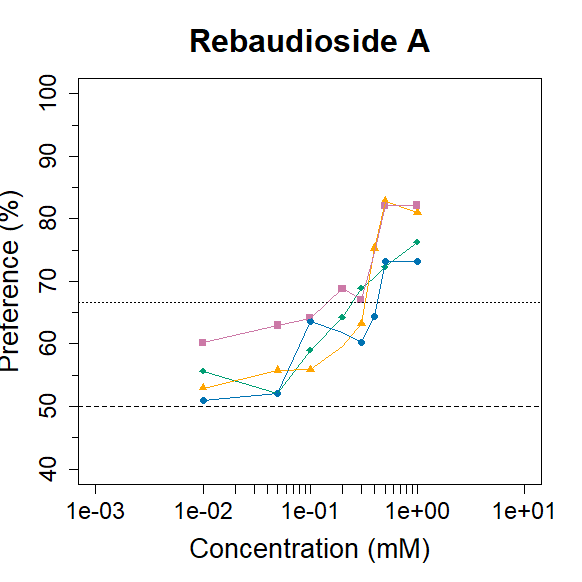
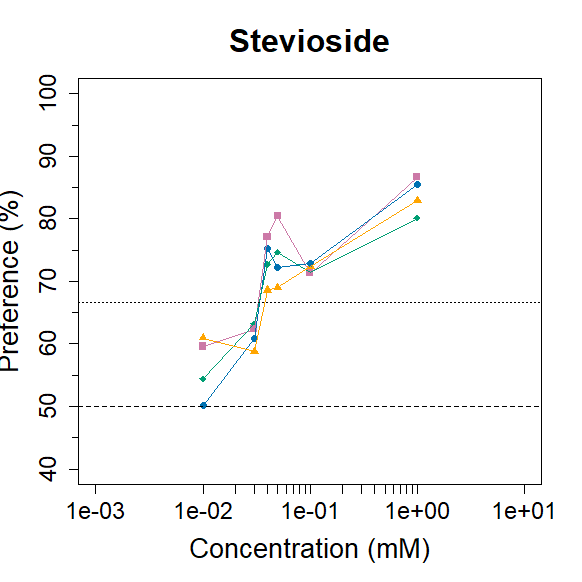
Figure 2. Taste preferences of four white-faced sakis for taste solutions of rebaudioside A and stevioside tested against tap water. Each data point corresponds to the mean value calculated from the 10 trials of 2 minutes performed per individual. The preference criterion and chance level are represented by the dashed lines at 66.7% and 50%, respectively.
As a group, the four white-faced sakis displayed a clear preference for sucrose over all four other carbohydrates, and fructose was substantially preferred over glucose, maltose and lactose when given the choice between two taste solutions presented at equimolar concentrations of 100, 200, and 300 mM, respectively (Fig. 3). This was also true when the four animals were considered separately. At 100 and 200 mM, the white-faced sakis did not display clear preferences between glucose, maltose and lactose as a group, whereas at 300 mM, they showed a clear preference for glucose over maltose as a group (> 66.7% of total consumption). Nevertheless, only three out of four of the animals reached the criterion of preference (> 66.7% of total consumption, plus binomial test, p < 0.05) when considered individually. At 200 mM and 300 mM, two and one of the four animals displayed a clear preference for lactose over glucose whereas the other two and three animals did not, respectively. In addition, at 200 mM one of the four animals displayed a clear preference for maltose over lactose whereas the other three did not.
Sucrose > Fructose > Glucose ≥ Maltose = Lactose
Interindividual variability was remarkably low and despite the exceptions mentioned before, all four animals either met the criterion of preference (> 66.7% of total consumption, plus binomial test, p < 0.05) for a particular stimulus combination or all four did not.
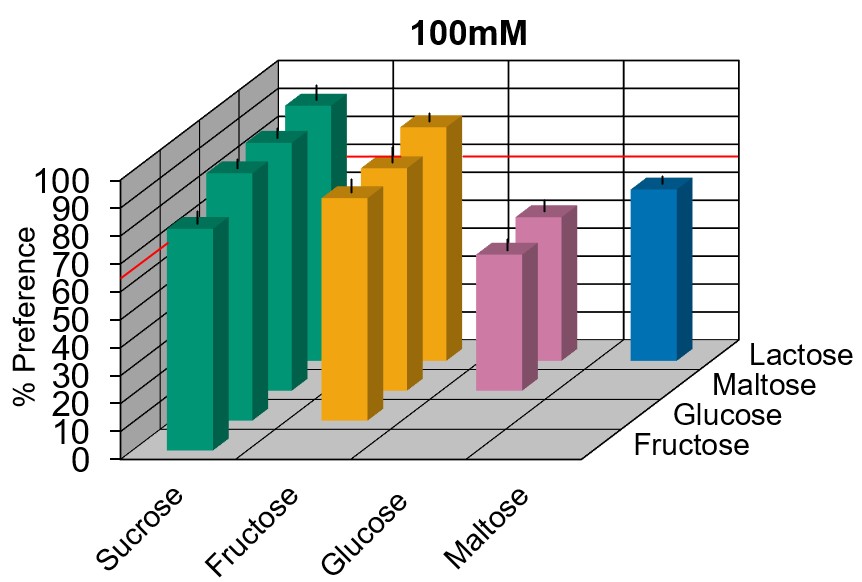
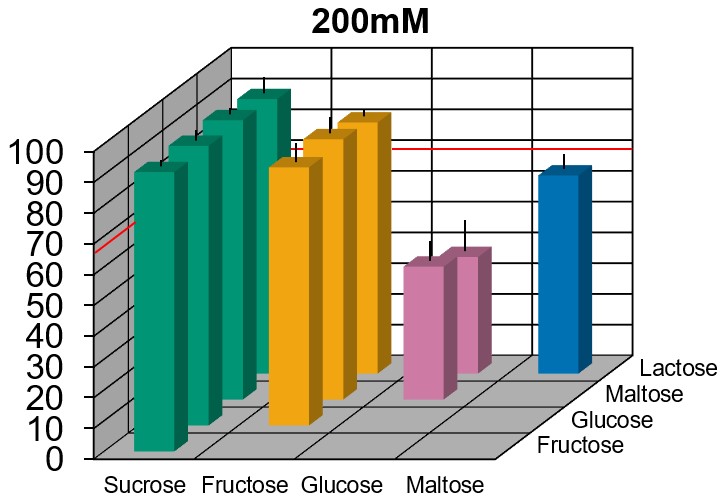
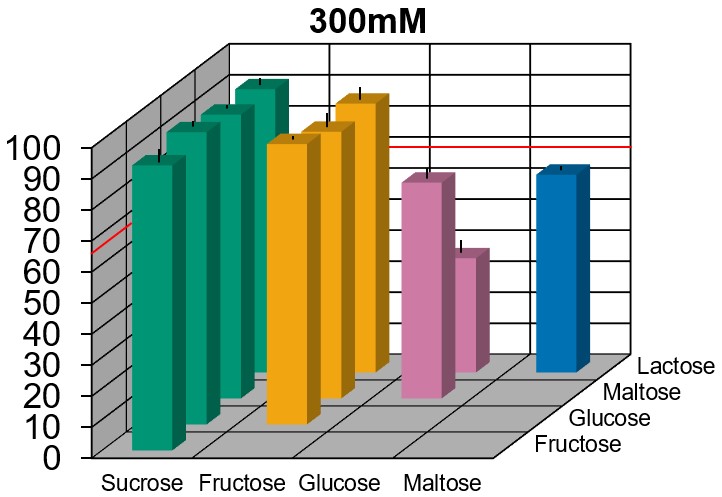
Figure 3. Relative taste preference of four white-faced sakis when given the choice between two taste solutions presented at equimolar concentrations of 100 (top), 200 (middle), and 300 mM (bottom), respectively. Each bar depicts the mean preference value (± SD) inferred from the 10 trials of 2 minutes performed per individual for the carbohydrate at the left relative to the carbohydrate at the right. The preference criterion is represented by the red line at 66.7%