Populations
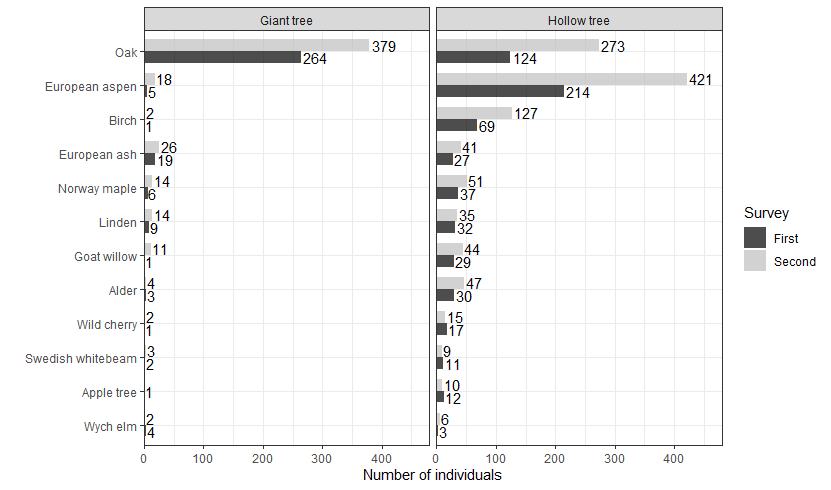
There was a large difference in abundance of hollow trees and giant trees between the two surveys. During the first survey, 315 giant trees, 605 hollow trees and 7 old trees (old trees without hollows or 0.8 m trunk diameter) where found in total. During the second survey, 476 giant trees, 1079 hollow trees and 10 old trees where totally found. The range in abundance of HBV trees in the plots was between 0 and 106. Hollow trees were the most common type of HBV tree in Östergötland. Oak was by far the most common type of giant tree, while European aspen, oaks and birches were the most common among hollow trees in Östergötland. Among hollow trees, the smallest hole stage (<10 cm) was the generally most common stage, while the second largest stage (20-20% cm) was the rarest stage. The most common vitality stage was Healthy (>50%), while low vitality (>20 %) was the rarest.
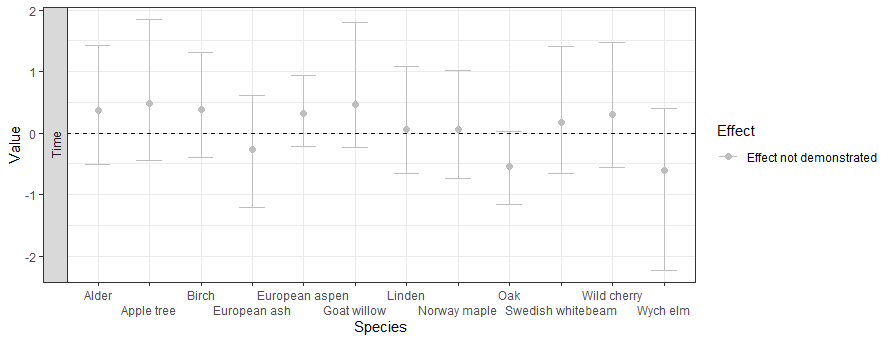
Effect of time on the three variables
Posterior distributions form the Bayesian regression model did not demonstrated a likely effect of time on any of the three variables. However, posterior means can be used to interpret possible indications of effects not demonstrated.
Posterior means and 95% intervall for time were centered around 0. Posterior means for hollowness did not show an effect of time.
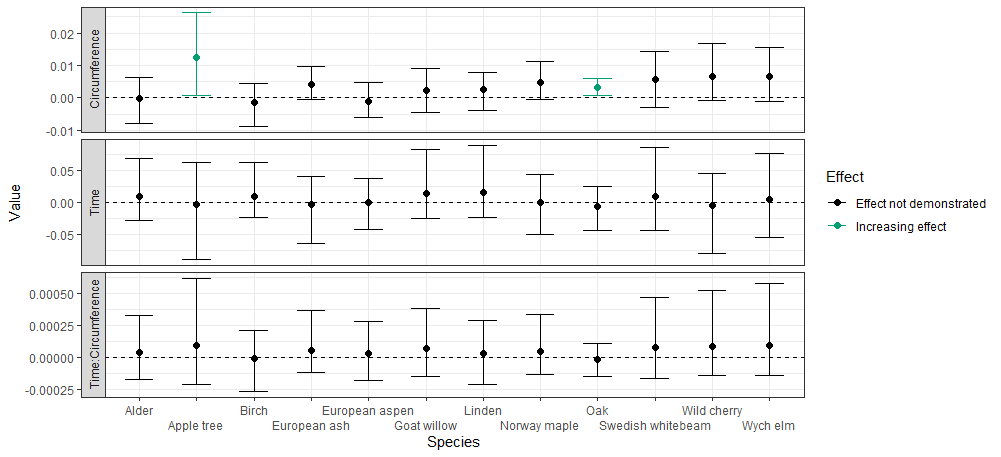
For vitality all posterior means where slightly positive, which is a small indication that a overarching negative influence causes the amount of trees in all populations to lower their vitality over time.
Posterior means for the effect of time on circumference are mostly seperated from positive, indicating a slight increase in circumference over time. Though among oaks the populations indicate a slight increase in tree with smaller circumferences over time.
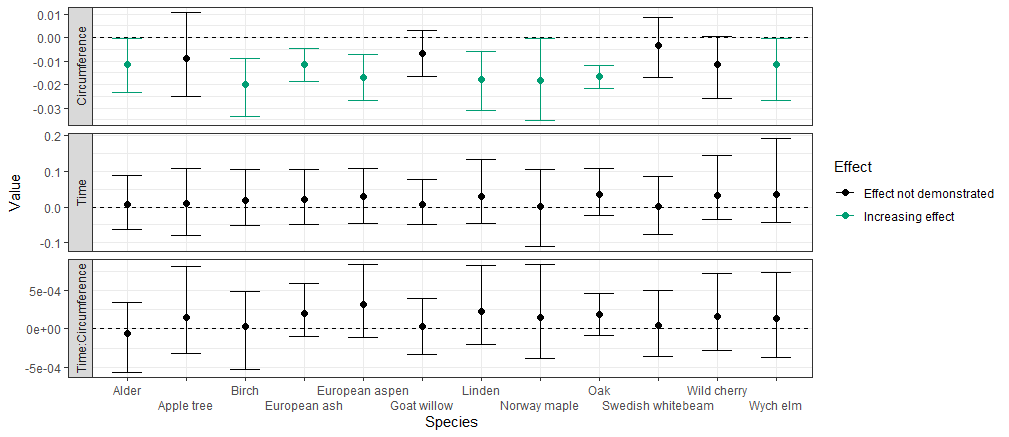
Effect of circumference
Results on the effects of circumference showed more clear effects than time. There was a general positive effect (2 species proven, 7 species postive posterior means) of circumference on hollowness. This indicates that larger circumferences could be an indicator of large hollowness. The effect of circumference on vitality was even more clear. 8 species/genre had a proven positive effect, while 4 species/genre had positive means. Larger circumferences indictes a larger portion of higher vitality.
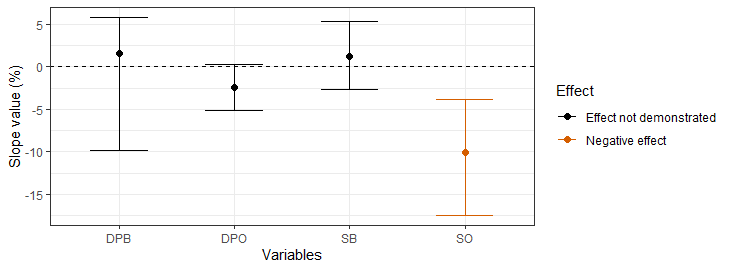
Effect of shading vegetation on oak vitality
Posterior parameter distributions show that adult trees outside of the living HBV oaks´s crown projections can negatively affect their vitality. Spruce tree outside the projections demonstrated a negative effect of about 10% per increase in coverage stage (Figure 9). Pine and deciduous trees combined outside the crown projections almost saw a negative effect (Figure 9). Negative posterior mean and an upper 95% credibility interval close to zero indicates that there probably is a negative effect, but it is not statistically proven. Adult trees below the oaks´s crown projections could not prove either a negative or positive effect.