Overall performance
The dyads´ performance in all three conditions (cooperative, blind and blind delayed) was significantly above chance level (binomial test; all p<0.001). However, there was a slight but not significant difference between the blind and cooperative conditions relative to the blind delayed condition, which had a lower success rate as well a more heterogeneous distribution (Figure 1).
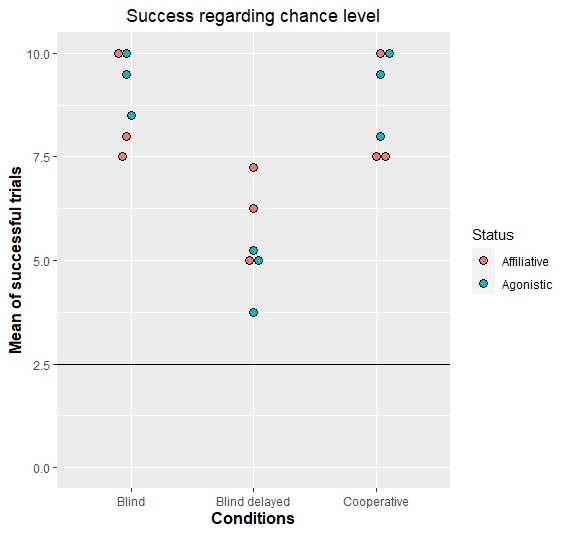
Figure 1. Representation of the average of the successful trials of each dyad per condition, based on their affiliation (Status). The black solid line represents the chance level (2.5 trials). The red coloured dots represent the affiliative dyads and the blue coloured dots the agonistic dyads.
Effect of affiliation in performance
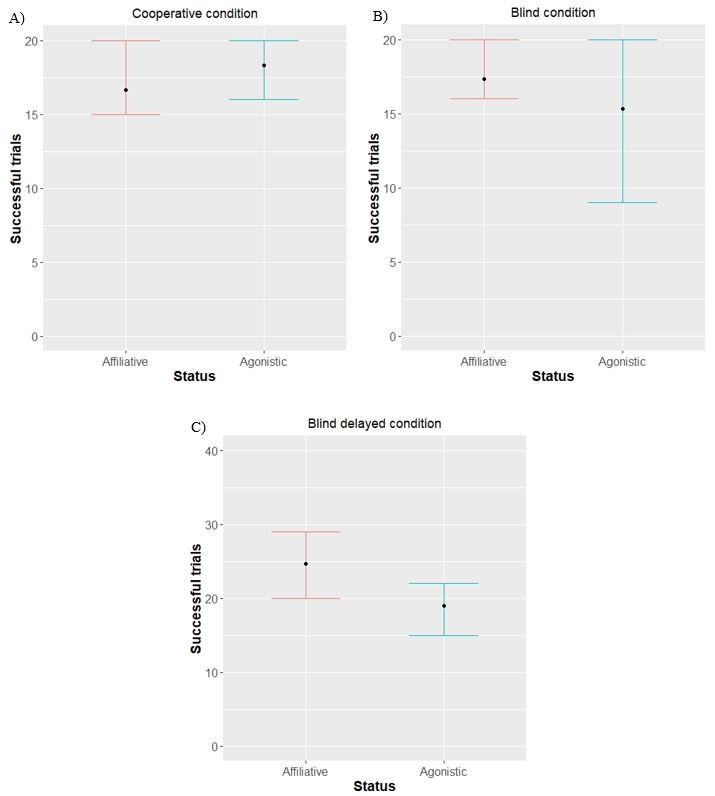
The comparison of the dyads based on their status showed that there were no significant differences in the success of affiliative and agonistic dyads for the cooperative (Chi2 =1.9, df=1, p=0.1675, Fig. 2A) and blind conditions (Chi2 =2, df=1, p=0.1569, Fig. 2B). However, in the blind delayed condition (Chi2 =4.86, df=1, p=0.0275, Fig. 2C) the affiliative dyads showed a significantly better performance with a higher success rate compared to those agonistic.
The comparison of the performances of the affiliative and agonistic dyads across the three conditions did not show any significant difference between any of them. The birds´ success rate in the condition with simultaneous access to the apparatus with full visual contact (cooperative condition) and the one with simultaneous access to the apparatus but without visual contact (blind condition) did not differ significantly (Chi2 =1.65, df=3, p=0.1986, Fig. 5A&B). Furthermore, for the blind and blind delay conditions (Chi2 =0.29, df=3, p=0.5892, Fig. 5B&C), and the cooperative and the blind delayed condition (Chi2 =2.87, df=3, p=0.09, Fig. 5A&C), no significant differences were found. Despite having a higher proportion of successful trials for the cooperative condition, the variation was not enough to provide a significant difference with the other two conditions.
Learning speed regarding “Status”
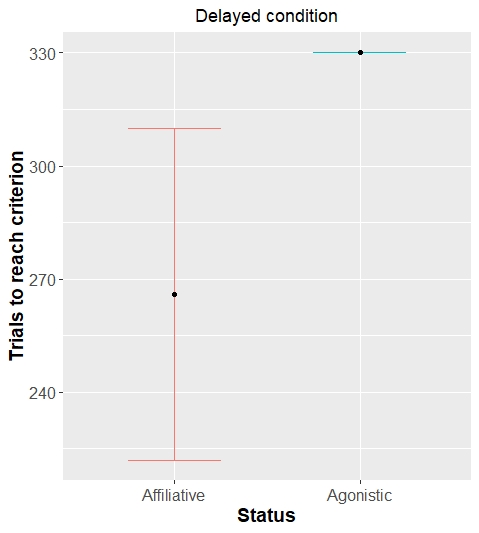
Figure 3 shows a visual representation of dyads that were performing the experiment for the first time and the number of trials required to learn that they needed to cooperate to solve the task. The birds in agonistic dyads required more trials to be able to coordinate their actions with their partners. There were significant differences (Chi2 =6.83, df=5, p=0.009, Fig. 3) between the dyads where there were birds repeating the experiment, thus the affiliative dyads were able to understand that they needed help from a partner with significantly lower number of trials. Figure 6 represents only the dyads that have not been previously exposed to the experiment. However, table 1 shows the number of trials needed to reach the criterion of doing 16 correct trials within the last 20 did not differ considerably for both groups when the dyads where at least one member was repeating the experiment were considered. Furthermore, the agonistic couple formed by Cersei and Khaalesi stood out from the rest, reaching the criterion quite early compared to the other dyads.
| Dyad | Status | Trials to reach criterion |
| Brienne/Cersei (NPE) | Affiliative | 310 |
| Khal/Tyrion | Affiliative | 154 |
| Khaleesi/Jaime (NPE) | Affiliative | 222 |
| Cersei/Khaleesi | Agonistic | 24 |
| Khal/Tormund (NPE) | Agonistic | 330 |
| Brienne/Tyrion | Agonistic | 180 |
Individual performance
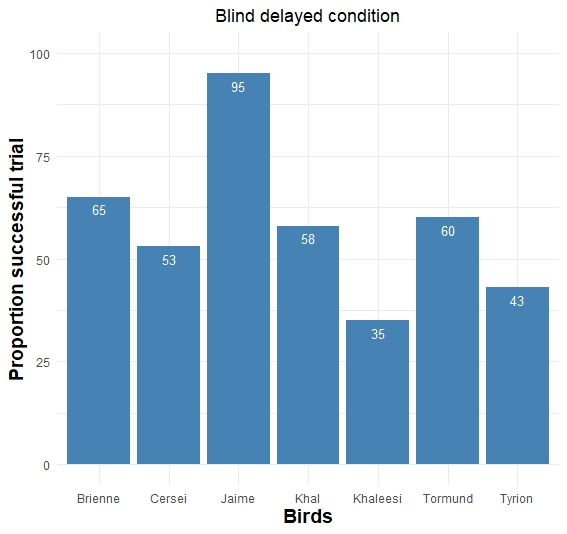
I found that the success rate varied depending on the bird having access to the string first. Figure 4 shows the proportion of successful trials per bird in the blind delayed condition. The parrots differed in success, with Jaime being the one that performed the best and Khaleesi the worst. This statement is supported by the comparison of all possible combinations of birds to assess if there were any significant differences in their success rates. Figure 4 shows that Jaime got a significantly better success rate compared to all other birds, however almost all birds had a significantly better success rate compared to Khaleesi and Tyrion, which were the worst.