Both hunters’ harvest and UVC showed a sublinear response for all three species, indicating a type-II functional response to population densities (Figure 3). Temporally, the sublinear response for roe deer is more evident in comparison to fallow deer and wild boar. Additionally, for roe deer, the sublinearity is more evident for UVC than it is for harvest.
Additionally, the γ shape parameter is the variability in the observed number of individuals. Roe deer have, compared to fallow deer and wild boar, a high γ value (Figure 4). The high γ value for roe deer means that there is low variability in the number of individuals observed. For wild boar and fallow deer, the 95% credibility interval includes a lower percentile < 0.05 and an upper percentile around < 0.09 (Figure 4), this suggests that both species have higher variability, compared to roe deer, in the number of individuals observed.
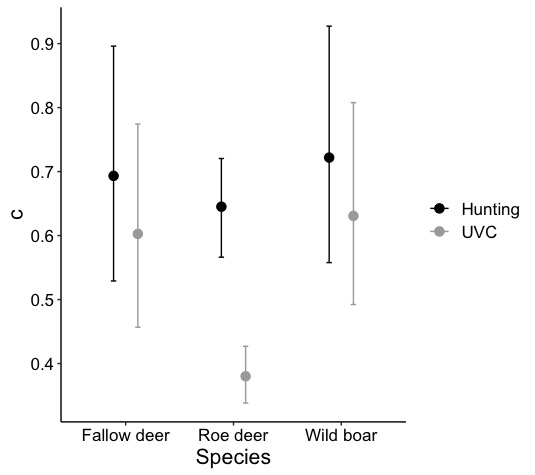

Figure 4. (right)Variability in individual observations (γ) of fallow deer, roe deer, and wild boar in Sweden between 2011 and 2020. The 95% credibility interval is shown with a 50% median and a lower and upper percentile at 2.5% and 97.5% respectively. A high γ value for indicates low variability in the number of individuals observed.
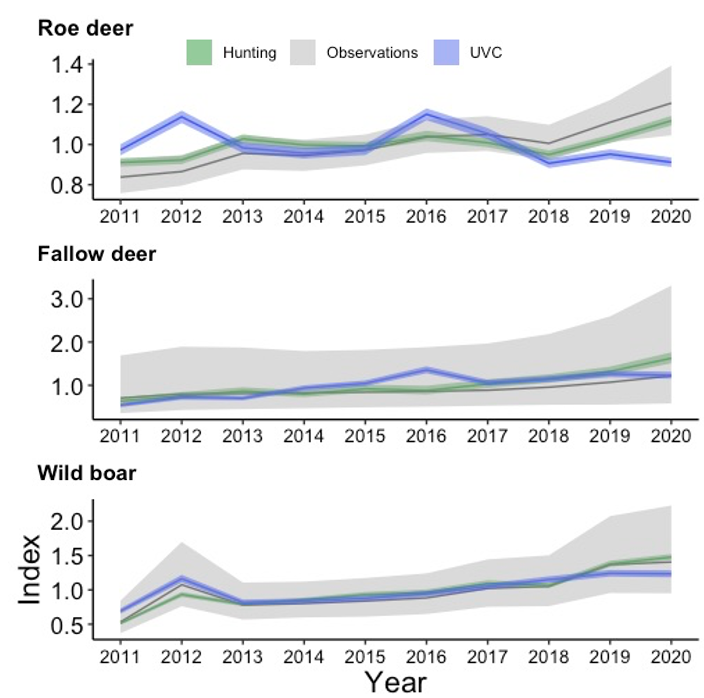
Trends regarding UVCs with roe deer do not seem to follow the population density (observations in Figure 5), furthermore, hunters’ harvest seems to follow the population densities but lessen at high population densities (Figure 5). The harvest for fallow deer appears to increase more over time compared to the index of observations, on the contrary, UVC seems to increase steadily over time and then plateau (Figure 5). For wild boar, both UVC and hunters’ harvest follow the observations (Figure 5).