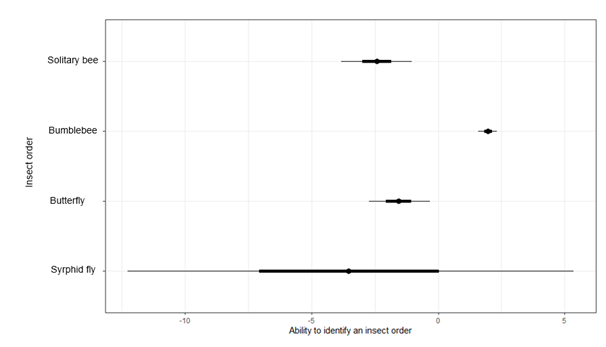
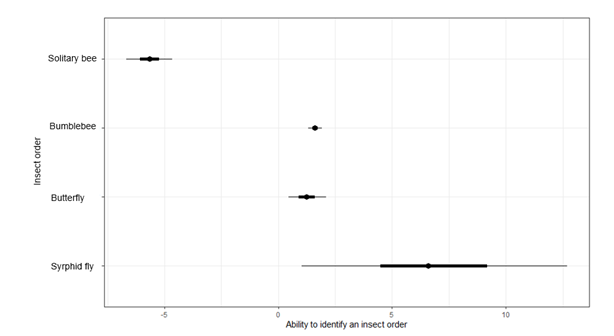
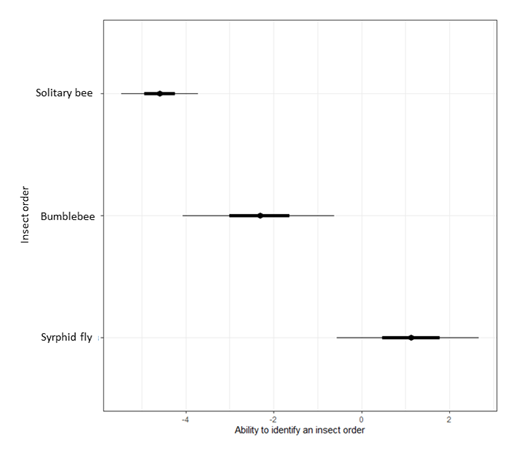
Difference in ability to correctly detect insect orders depending on their proportion
In general, the more bumblebees (1.96) in a string, the higher degree if agreement for students (Figure 1). The more syrphid flies (-3.48) and solitary bees (-2.43) in a string, the lower degree of agreement (however there is a lot of variation in syrphid flies). Interestingly, when there were more butterflies (-1.57), the degree of agreement became lower.i
In general, the more bumblebees (1.62) and butterflies (1.26) in a string, the higher degree of agreement for children (Figure 2). Shockingly, the more syrphid flies (6.79) in a string, the higher degree of agreement (however there is a lot of variation in syrphid flies). Solitary bees (-5.66) is the only insect order that became harder to see when its proportion increased in a string.
In general, the more bumblebees present during a transect (-2.32), the lower degree of agreement (Figure 3). The more syrphid flies (1.11) and solitary bees (0.12) present during the transect, the higher degree of agreement.
Age
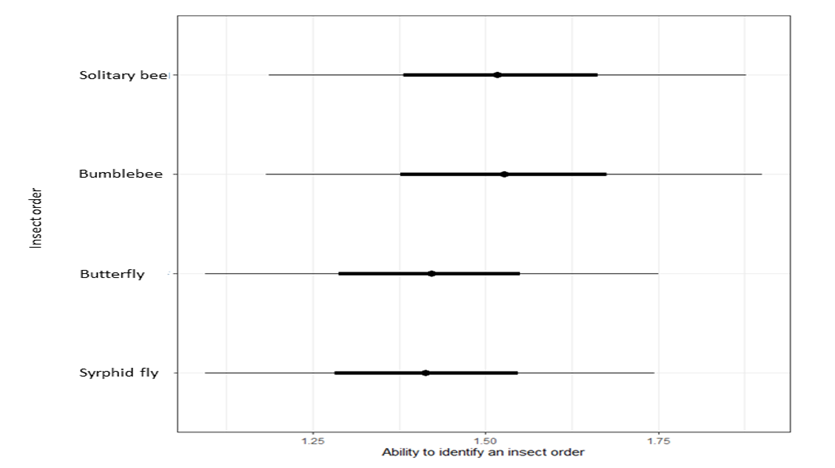
In general, students are better than children to detect all insect orders when there is a higher proportion of the insect order in a string (Figure 4). However, there is a lot of variation in all insect orders (large quantiles).
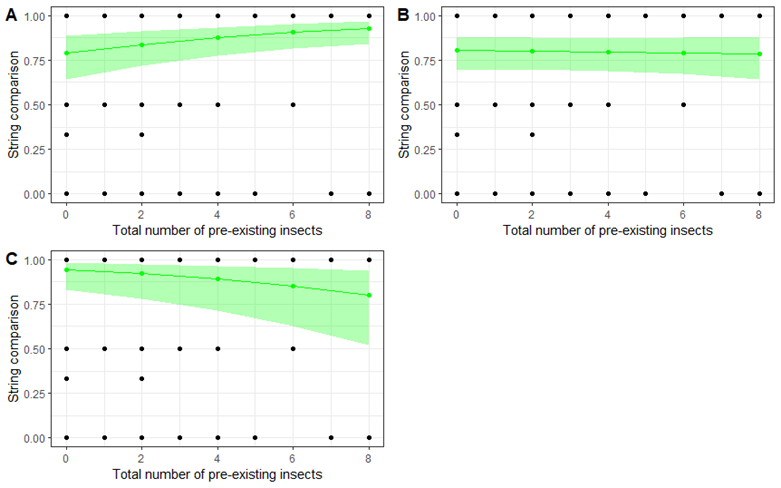
Cognitive load
When the number of pre-existing insects in a square increase with 1 individual, it gets 16% easier for students to detect bumblebees (exp(0.15)) and 16% harder to detect butterflies (exp(-0.17)). The number of pre-existing insects in a square seem to not affect students ability to detect solitary bees (exp(-0.01)). Bumblebees and butterflies are significant since their P-values is <0.05 (0.004, 0,0009). Solitary bees are not significant since their P-value is >0.05 (0.7) (Figure 5).