Department of Physics, Chemistry and Biology (IFM)
Results
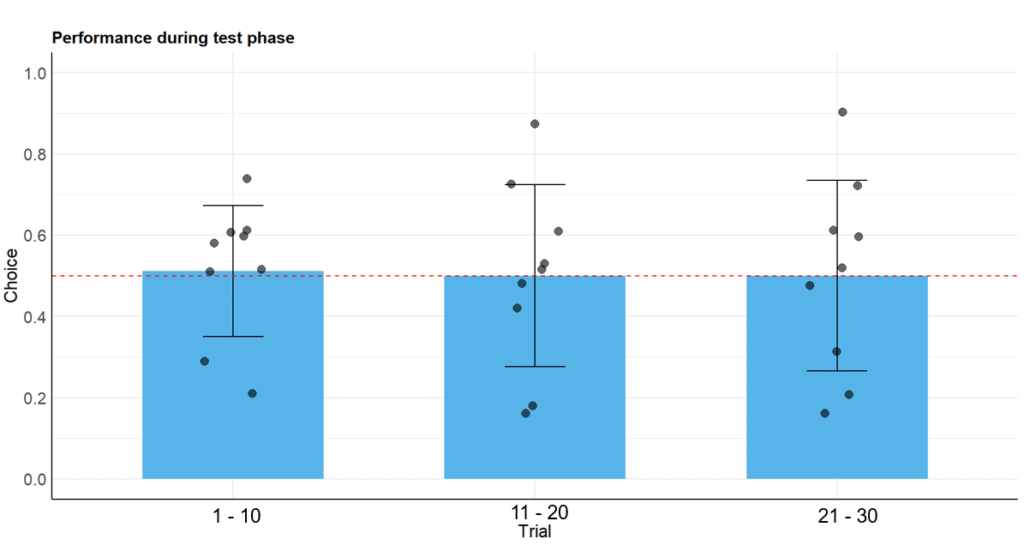
All dogs managed to complete all phases of the test. The combined data from phase 4 of all 9 dogs can be seen in the graph bellow. Statistical tests on the average choice made in phase 4 show no deviation from chance and the average choice is around 0.5.
The graph shows all 30 trials divided into 3 columns. The columns show the average choice made by all 9 dogs of the study in Phase 4 between the trails 1-10, 11-20 and 21-30. The points show the individual dog’s average choice within the same trial range. On an individual level the dog could only chose 1 or 0 (1 = black or white, color associated in Phase 2 or 0 = the other color)which can be seen on the Y-axis.