Small-scale habitat preferences:
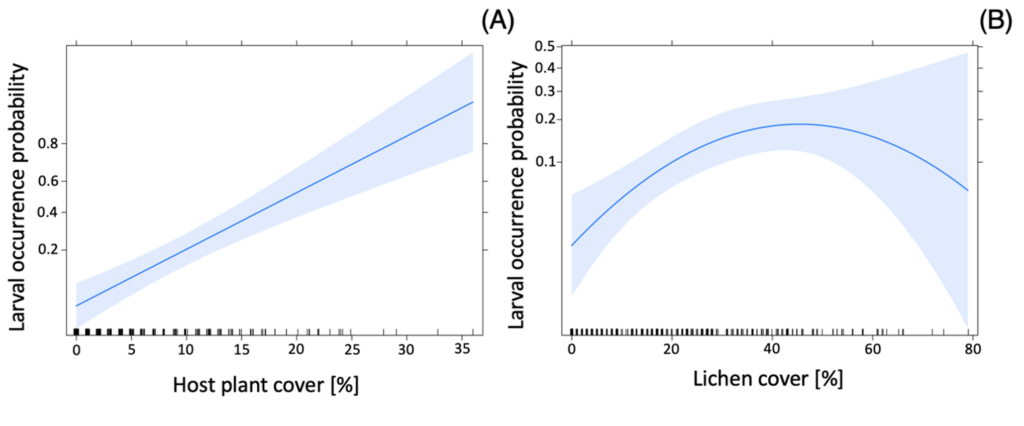
The analysis showed that larval occurrence was best explained by host plant and lichen cover. Larval occurrence probability increased with increasing host plant cover and had an optimum lichen cover of roughly 40 %. The variables grass and other plant cover showed a significant negative relationship to larval occurrence when tested separately but became redundant in a multivariate model where lichen cover was included.
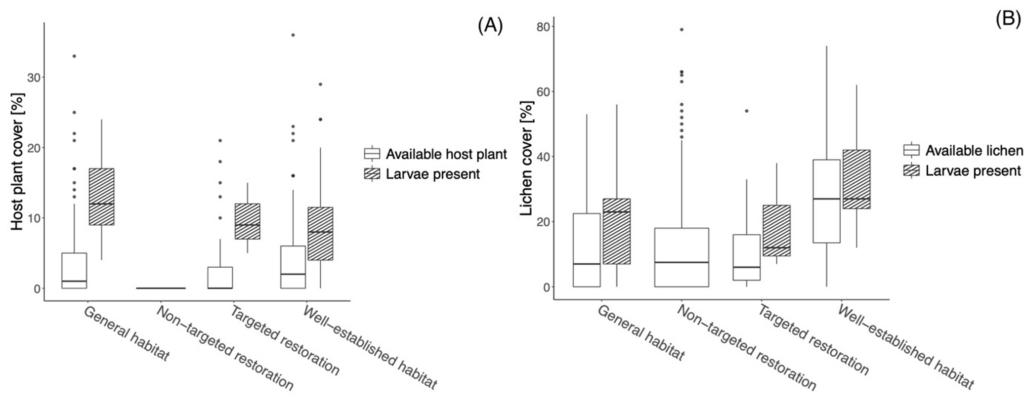
Host plant and lichen cover was most abundant in the well-established habitat (reference area). In the non-targeted restoration host plant cover was critically low. In all study areas larvae were found where host plant cover was above average, especially in areas with overall lower host plant cover. This also applies to the available lichen cover compared to the lichen cover where larvae were present. In contrast, both grass and other plant cover had the highest average cover in the non-targeted restoration. In all study areas larvae were generally found where grass and other plant cover was below average.
Large-scale habitat preferences:
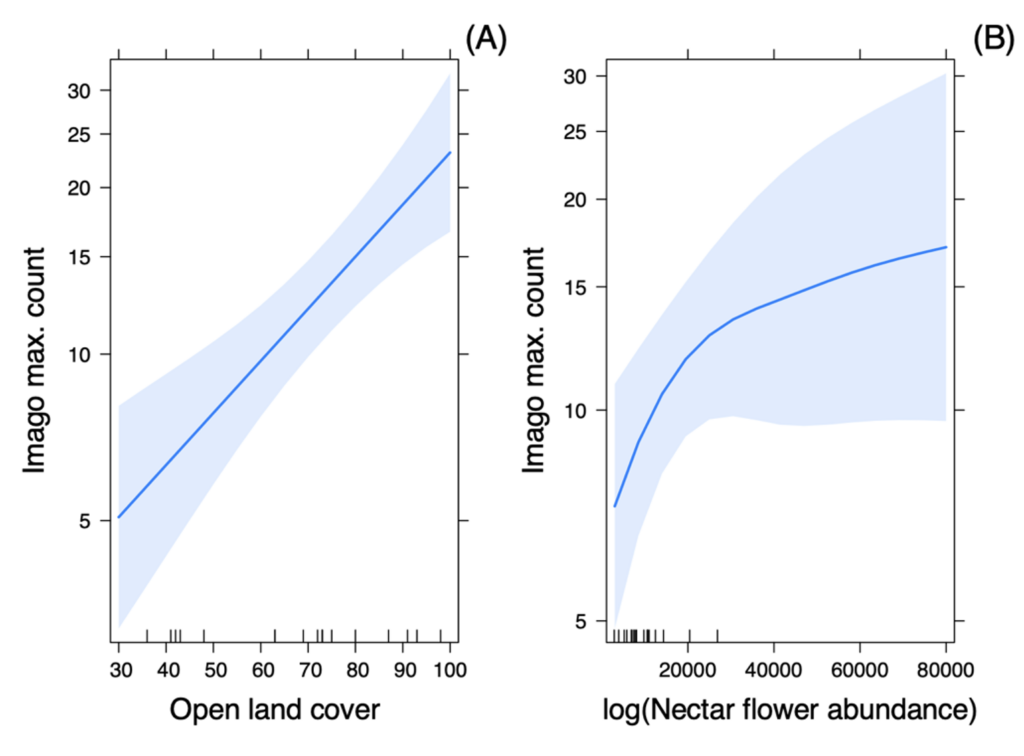
The analysis showed that maximum imago counts were best explained by open land cover and nectar abundance. When tested separately, tree cover, bush cover, and connectivity also explained the number of imago significantly. Increasing tree and bush cover showed a negative relationship to the number of imago, while increasing connectivity showed a positive relationship. However, in a multivariate model that included open land, tree cover, bush cover, and connectivity became redundant.
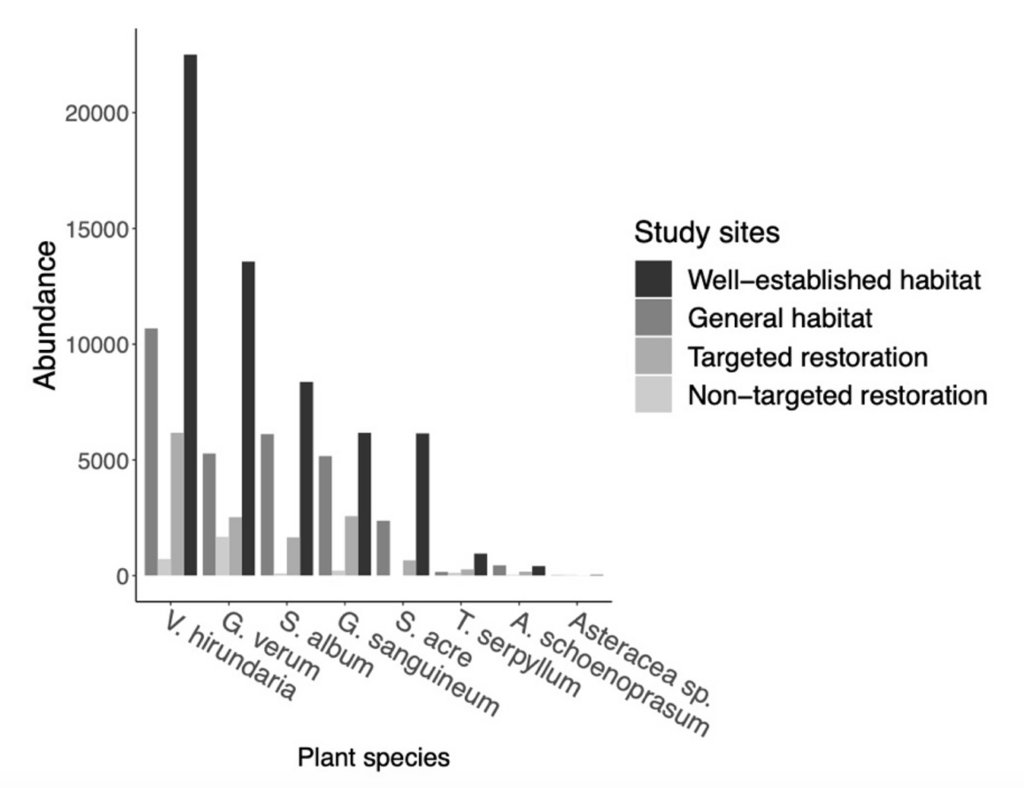
Nectar flowers were most abundant in the well-established habitat, and least abundant in the non-targeted restoration. Similarly the nectar flowers the Apollo was observed feeding on in 2022 were also most abundant in the well-established habitat (See Fig. on the left). The nectar survey also showed that the Apollo feeds on a narrow range of nectar plants and that foraging plants changed from year to year, with only some recurring forage plants (Thymus serpyllum, Sedum album, Geranium sangunieum, Allium schoenoprasum and Asteracea sp).
Apollo densities between years:
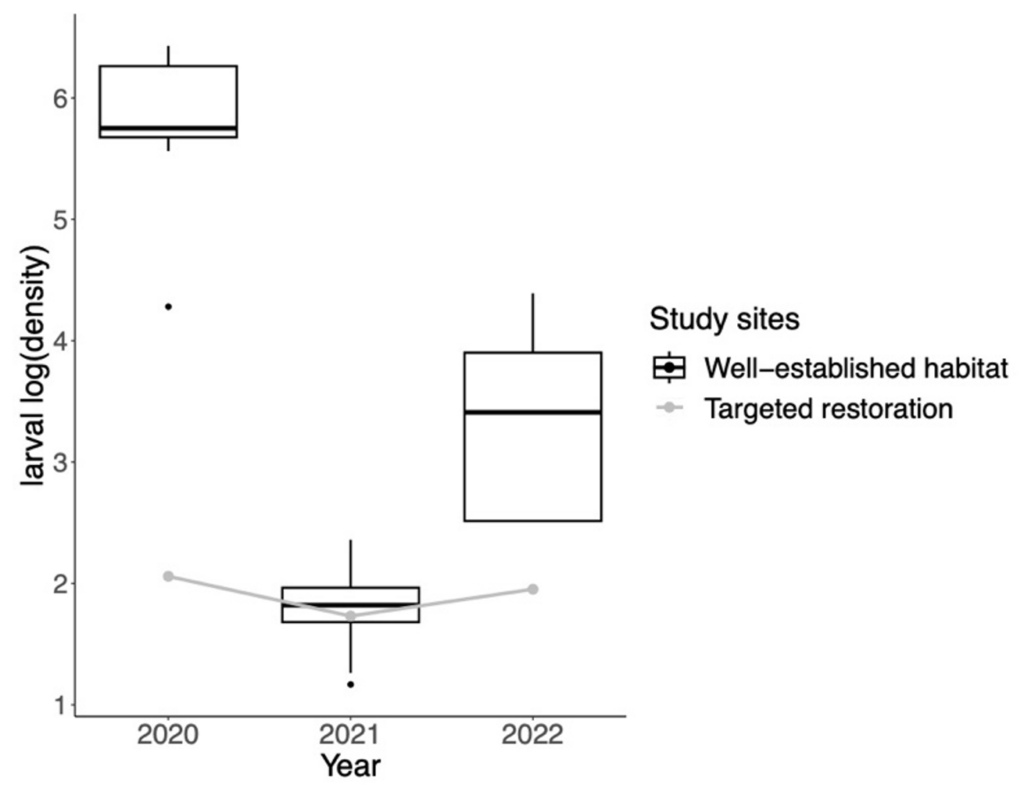
Comparing larval densities across years, numbers in the well-established habitat were highest in 2020, declined in 2021, and increased again in 2022. The targeted restoration area also had its highest larval density in 2020 and lowest in 2021, with less fluctuation between years. No larvae were found in the non-targeted restoration area between 2020 and 2022. Due to insufficient data on larval density in the general habitat in individual years, it was not considered.
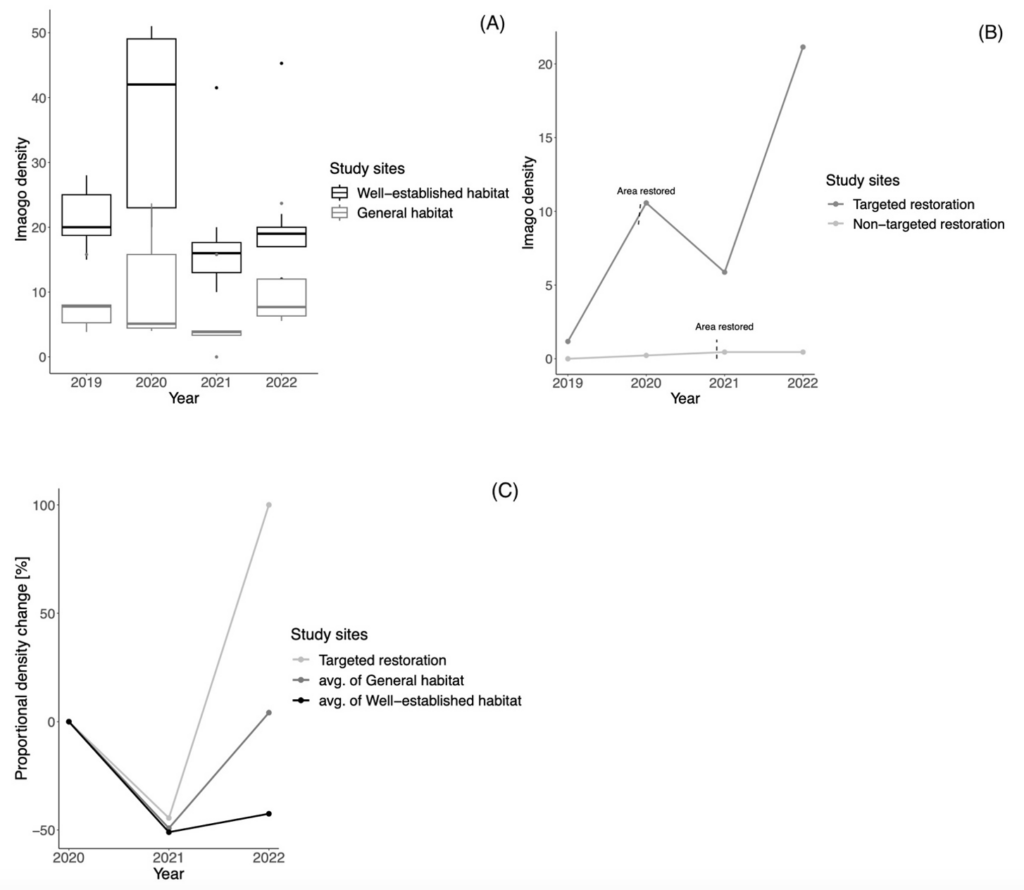
Comparing imago densities between years, a strong increase in densities was observed in 2020 in all study areas, followed by a decrease in 2021. However, in 2022, densities increased again in all areas. The imago densities in the well-established habitat remained relatively stable over time, apart from the steep increase in 2020 (Fig. A). More distinct fluctuations were observed in the general habitat over time (Fig. A).
Imago densities in the targeted restoration followed a population trend similar to that in the reference areas (Fig. B). Following the 2020 restoration, densities increased significantly, declined in 2021, but remained higher than pre-restoration levels. Densities actually decreased proportionally more in the reference areas than in the targeted restoration (Fig. C). In 2022, imago densities increased again and reached their highest levels since the 2020 restoration, and the proportional increase clearly surpassed both reference areas.
Imago densities in the non-targeted restoration were consistently low, with a slight increase after the 2021 restoration but remaining unchanged in 2022 (Fig. B)