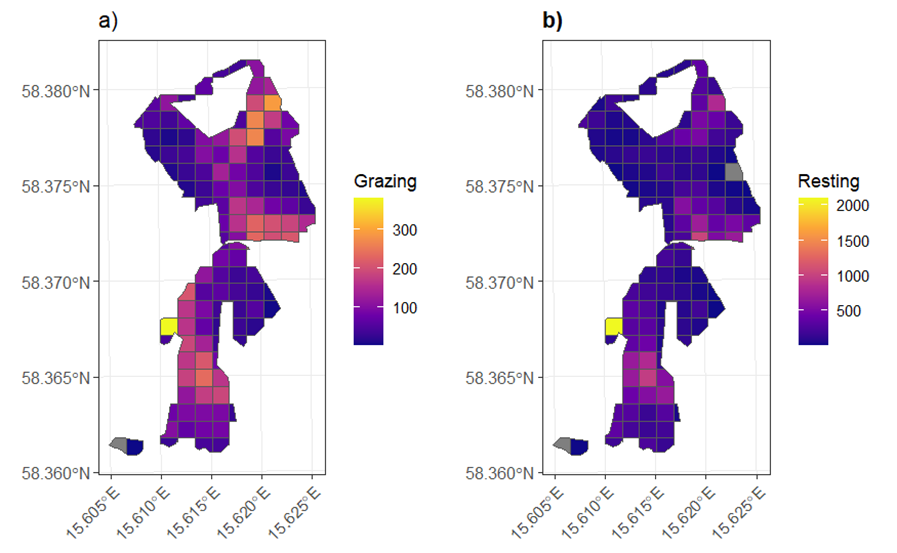
Spatial density distribution of cattle
Cattle prefered certain areas on pastures presumingly based on different environmental factor and vegetation characteristics. No significant differences could be found regarding habitat preference between the spatial density distribution of the behaviour groups resting and grazing.
Environmental impact on the spatial distribution of grazing cattle
In the singular models for both behaviours all environmental factors were siginificantly influencing the habitat preferences of the cattle. Analysed for the grazing cattle in one modell, the grazing cattle showed similar responses to the environmental factors like in the singular models.
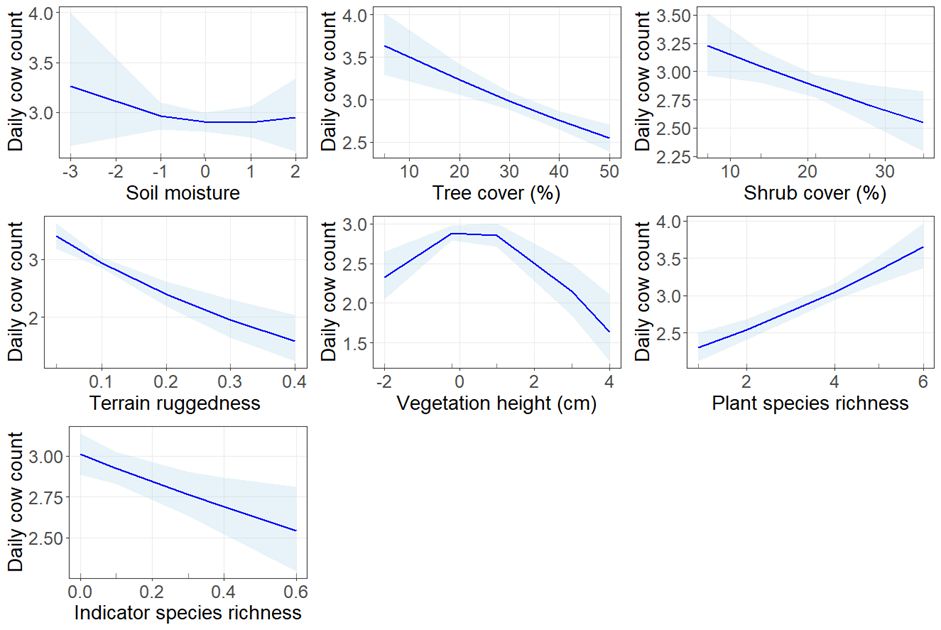
Grazing cattle showed a clearly negative linear response to tree and shrub cover which were highly significant, while species richness showed a strong positive linear response in cattle density of the high significance. The non-linear response to vegetation height and was also significant and shows preference for medium low vegetation height. Grazing cattle showed a weaker negative linear response to indicator species diversity, with more variation at the higher value end, however, this observation was not significant. Furthermore, cattle showed an overall negative non-linear response to soil moisture, that was not significant. Terrain ruggedness showed a highly significant negative linear response of grazing cattle.
Changes in spatial density distribution due to weather factors
Changes in habitat preference (canopy cover and soil moisture) due to raising tempertures were non-significant for grazing cattle; only increasing percipitation levels lead to an increase in preference for tree cover. For the resting cattle however, the preference for tree cover increased significantly increasing temperature, while the preference for soil moisture decreased simultaneously.
Ecological implications
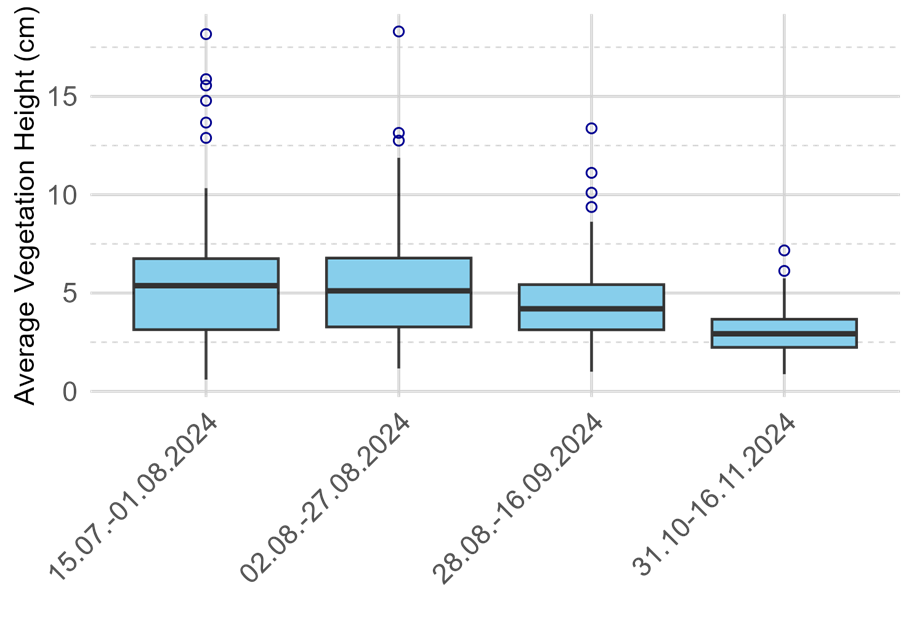
The vegetation height decreased in value and variation during the study period. The average vegetation decreased from around 5 in the grazing season to around 3 in the after season. The vegetation height in the afterseason varied between 3 and 4.
In total 198 plant species were found, which 11 were classed as indicator species. The highest species rich areas matched areas of high and medium grazing intensity as well as open areas of medium vegetation height and medium soil mositure.
Nutrient transfers
A chi square test showed that the areas of high cow dung density are not significant differently to the areas that show a high density for grazing events.
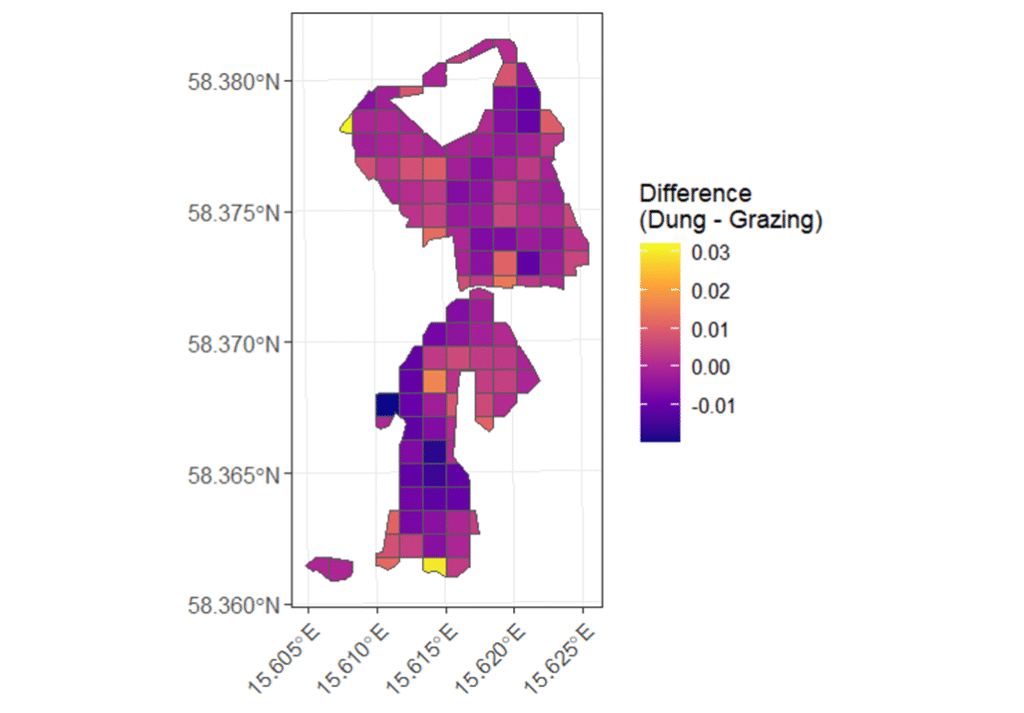
The map shows that there are areas of higher grazing density than cow dung (dark purple), indicating areas of nutrient depletion, and areas of higher cow dung density (yellow), indicating areas of nutrient accumulation, within both pastures. The test for a relationship between species richness and nutrients showed a significant negative response of species richness to higher differences (cow dung porportion bigger than porportion of grazing density). The indicator species richness showed a similar responser, it was however, not significant.