Temperature Loggers
A total of twenty temperature loggers were placed at various locations across some of Sal’s densest nesting areas. Larger beaches required a second logger, typically positioned further inland. The loggers operated throughout the entire nesting season and were retrieved at the end. However, some loggers could not be recovered.
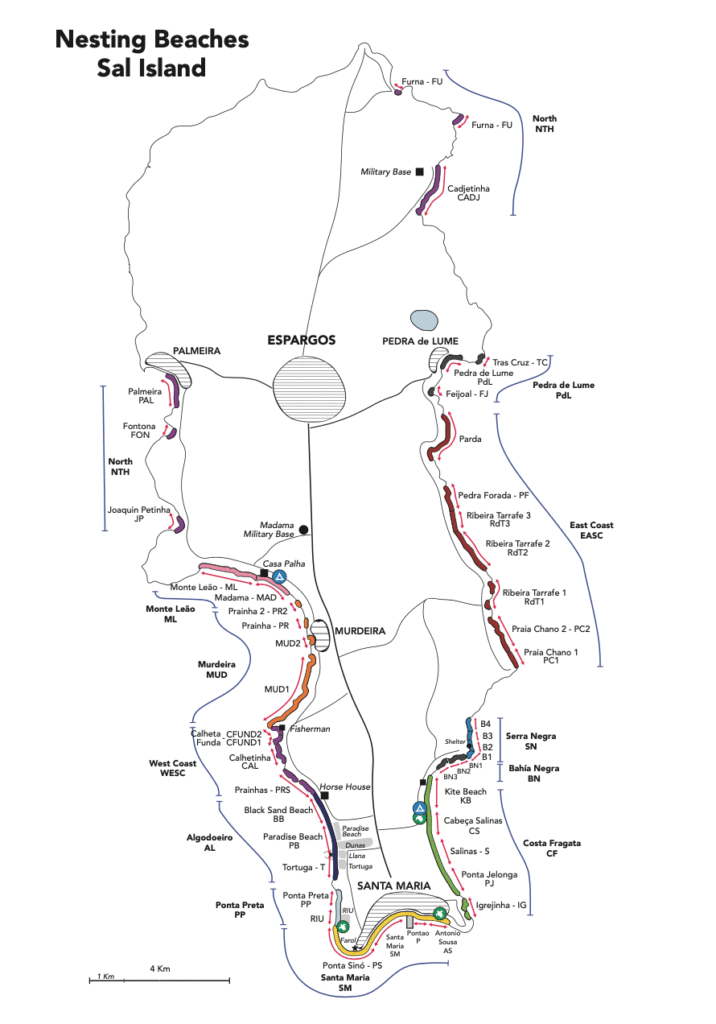
Most nesting happens in the south of the island and that is also where the project’s headquarters are! Locations were divided between East and West.
Hatchery data
At the same time, nest success rates were collected from two of the project’s hatcheries (RIU and Tortuga) as hatchlings started to emerge from the relocated nests. Both hatcheries had two areas, Shaded and Unshaded, both with a logger. Temperature profiles were also collected.
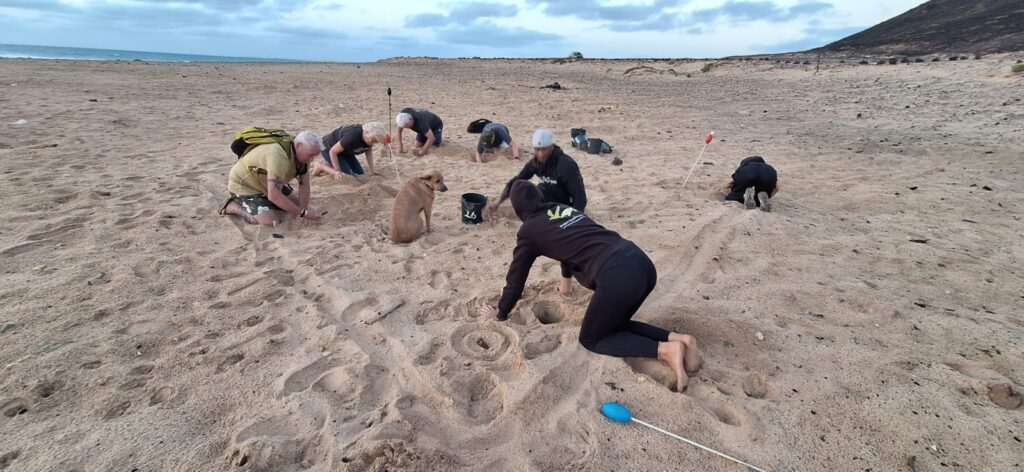
I also collected some nesting information in random spots along the densest nesting areas by plotting 5×5 m squares and digging everything inside! These plots served to compare success rates between both sides of the island.
Statistical Analysis
To compare the island sides (East vs. West), I performed a Kruskal-Wallis rank sum test, followed by a Dunn’s test for pairwise comparisons between months. To assess 29ºC exceedances across all locations, I conducted a one-sample t-test, using a threshold where more than 50% of days are expected to surpass this temperature.
Hatchery data were analyzed based on sand temperature, considering the condition (Shaded vs. Unshaded). I used a Wilcoxon rank-sum test to compare both hatcheries.
All statistical analyses were performed using RStudio, with a significance level of 0.05, indicating a 5% probability of incorrectly rejecting the null hypothesis.