Resting and activity allocation
The first individual tagged (HW1) spent 29.4 % of its total recorded time displaying resting behaviours, including both resting dives and surface resting, whereas the second individual (HW2) spent 52.3 % of its time resting. The distribution of resting time differed significantly between the two individuals (Mann-Whitney U test: p < 0.05).
Differences in dive profile
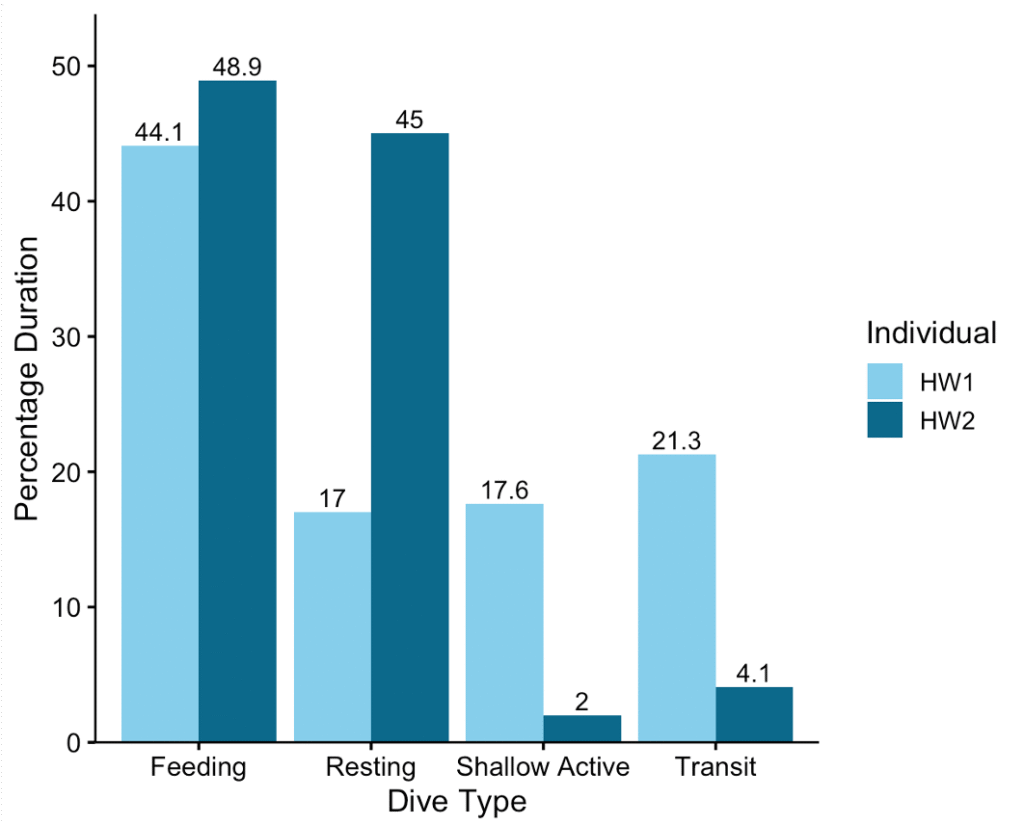
The two tagged whales displayed distinct dive profiles, differing in:
- dive type occurrences (Chi-Squared test: χ2 (3) = 37.84, p < 0.001)
- duration (Fig. 1)
- depth
- post-dive surface time
- fluke stroke rate (Mann-Whitney U test: p < 0.05, for all categories)
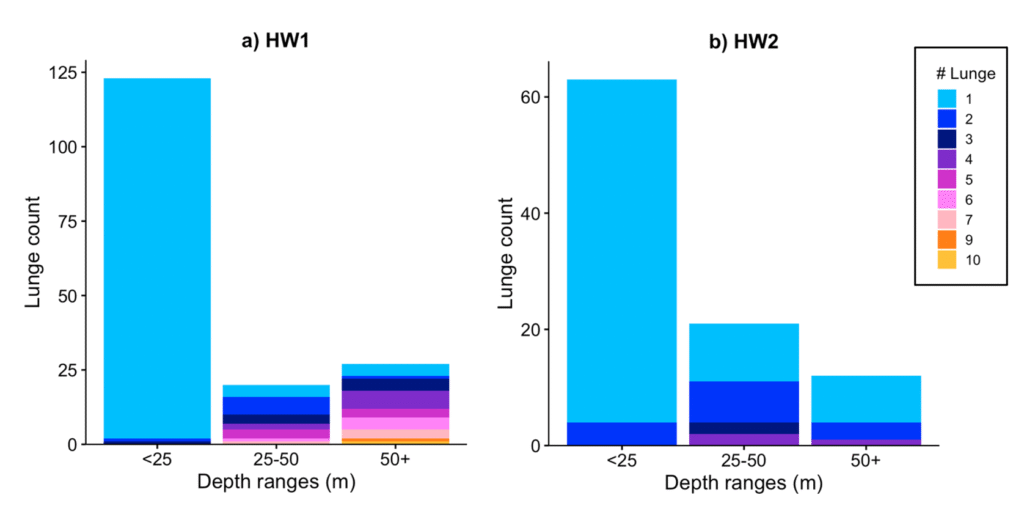
Distribution of lunge feeding events
A total of 308 lunge feeding events were recorded for HW1 (20 lunges/hour). A total of 123 lunge feeding events were recorded for HW2 (11 lunges/hour).
The mean and median numbers of lunges per dive varied with dive depth (Fig. 2). For both individuals, the majority of shallow dives (<25 m) contained only one lunge. For HW1, both the mean and median number of lunge feeding events per dive increased with dive depth, whereas for HW2, the mean and median number of lunges per dive remained relatively constant, ranging between one and two across all depth categories.
Diel variations
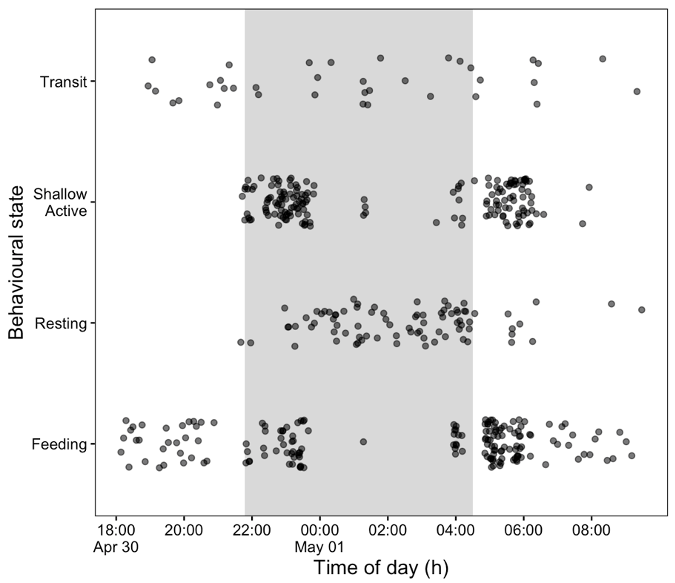
Diel variations were only assessed for HW1 because HW2 was tagged during midnight sun (no true night).
HW1 displayed more resting dives at night and more feeding dives during daylight hours (Chi-Squared test: χ2 (3) = 70.33, p < 0.05)
Feeding dives were shallower at night (Mann-Whitney U test: p < 0.05).