
Data were collected in 2012, 2013, and 2015 in the Strait of Gibraltar, where six social groups of long-finned pilot whales were simultaneously tagged with DTAGs, digital tags that record both sound and movement. These bio-logging devices were attached using suction cups and programmed to stay on the animals for up to 24 hours.
The DTAGs captured fine-scale acoustic and behavioral data, enabling analysis of vocal output levels, dive behavior, and environmental noise. This setup allowed us to investigate how whales adjusted their vocalizations in response to varying noise levels, depth, and behavioral context.

The processing of the DTAG recordings began with manual auditing, where trained observers labeled each call by call type and the individual whale that produced it. These labeled calls were then passed through a machine learning model, which extracted acoustic features and grouped similar calls using unsupervised clustering techniques.
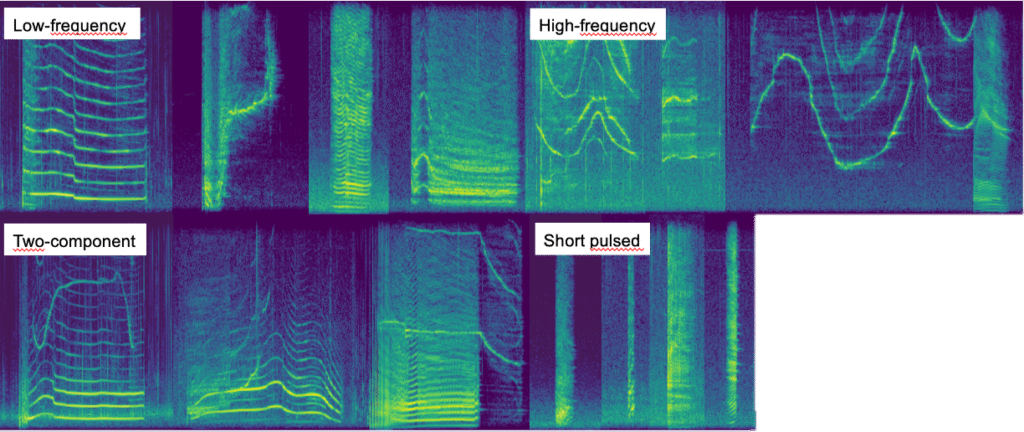
As a result, calls were categorized into four distinct types based on their acoustic structure:
- Low-frequency calls
- High-frequency calls
- Short pulsed calls
- Two-component calls
This classification allowed us to examine how vocal output levels varied not only with ambient noise and depth, but also across different call types.
To analyze the influence of dive context, each call was linked to its corresponding dive phase using depth profiles generated for each tagged social group. We classified vocalizations into four dive contexts based on depth:
- Surface: 0–80 m
- Shallow dive: 0–300 m
- Deep dive – descent phase: 0–800 m
- Deep dive – ascent phase: 800–0 m
The dive plot (shown below) illustrates the diving behavior of three tagged individuals, with overlaid dots representing detected foraging events. Red dashed lines indicate the depth boundaries used to define each context.

We used linear mixed-effects models to estimate the magnitude of the Lombard response. Four models focused on the effect of call type, while five additional models incorporated depth and dive context as predictors to explore how these factors influenced vocal amplitude adjustments.