I. Single repeats
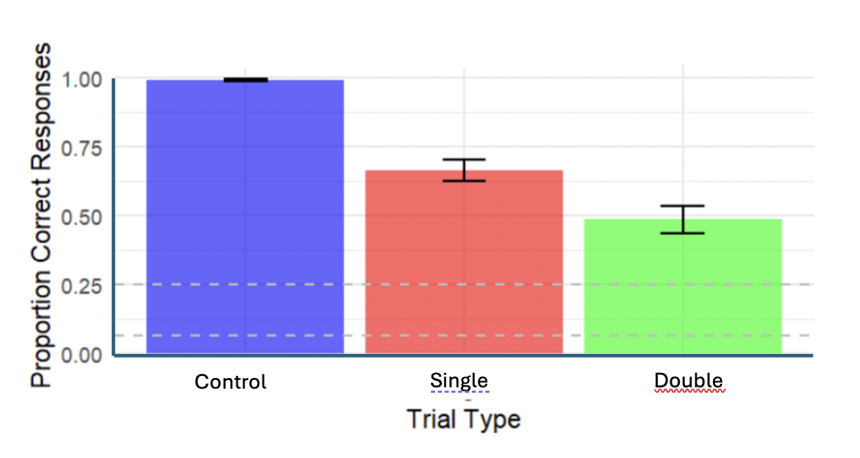
All individuals performed significantly above chance level across all four behaviors (p-value: <0.0001). The birds performed with approximately 75% accuracy (chance level= 25%). There was no significant difference of performance between the birds (variance= 0).
II. Double repeats
All of the parrots performed above chance level across all four behaviors with a ~60% accuracy (p-value= <0.0001, chance level= 6.25%). There were small individual differences in the performance between bird of 0.153.
III. Delayed repeats
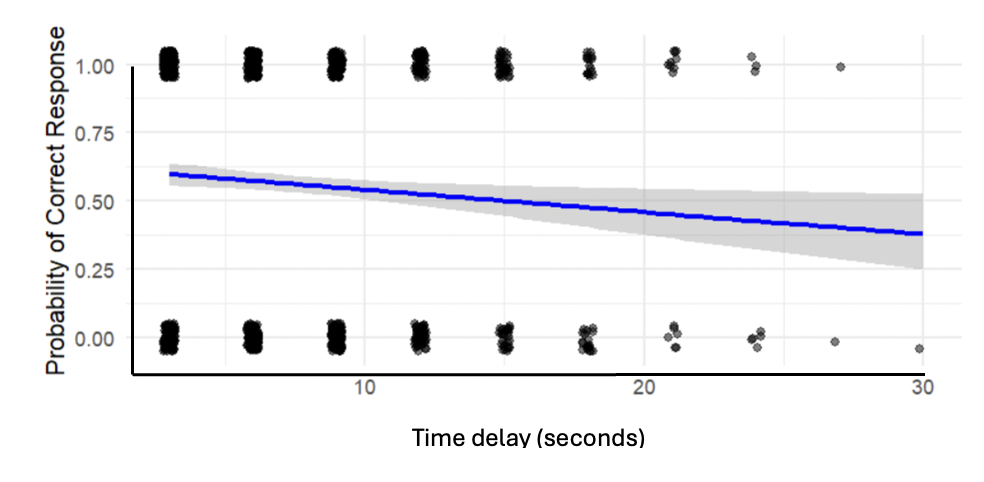
The probability of a correct response significantly diminished as the delay time increased (p=0.003). The birds performed significantly above chance level for up to 21 s delay (CI= 95%).
What do the results mean? How do they compare to the reported literature? I talk about it on the Discussion.