STUDY A
The three groups showed significant differences in both the occurrence (H=6.489; P=0.039) and duration (H=7.2; P=0.027) of their individually standing alert behaviour, with posthoc tests revealing that the Feral Group exhibited this behaviour more frequently (P=0.034) and for longer durations (P=0.022) than the Managed Group.
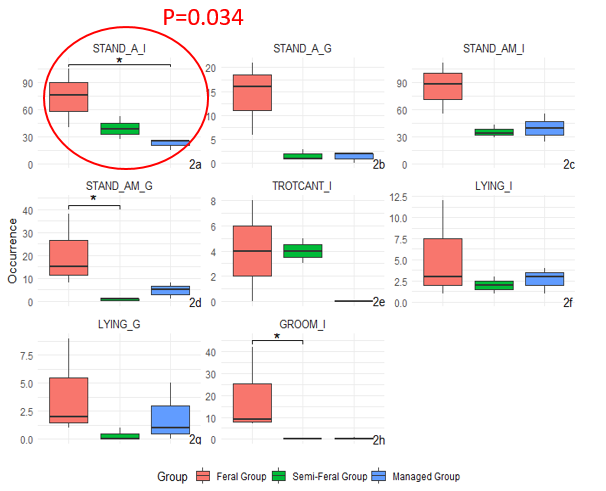
Figure 2 : Occurrence of the behaviours a) Standing alert (one individual), b) Standing alert (>1 individuals), c) Standing alert towards me (one individual), d) Standing alert towards me (>1 individuals), e) Trotting/cantering (one individual), f) Lying (one individual), g) Lying (>1 individuals), h) Grooming (one individual) for the three groups. *P<0.05
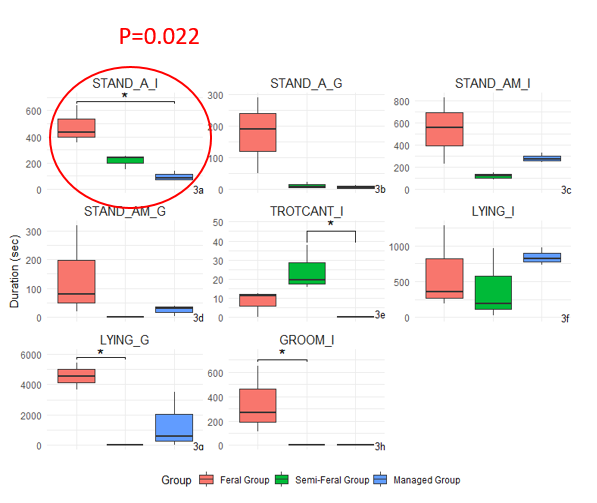
Figure 3 : Duration of the behaviours a) Standing alert (one individual), b) Standing alert (>1 individuals), c) Standing alert towards me (one individual), d) Standing alert towards me (>1 individuals), e) Trotting/cantering (one individual), f) Lying (one individual), g) Lying (>1 individuals), h) Grooming (one individual) for the three groups. *P<0.05
STUDY B
Standing alert behaviour
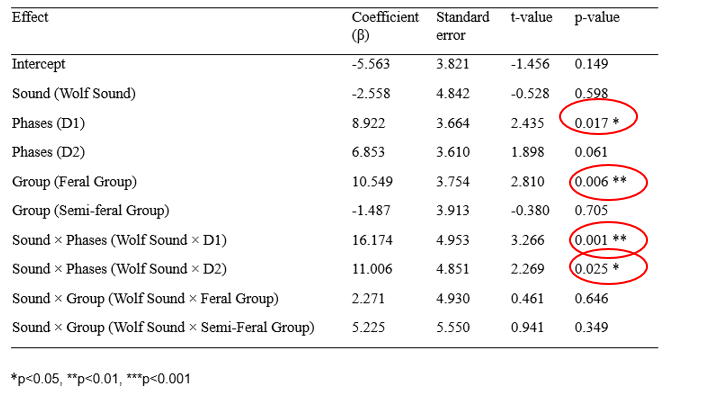
The standing alert behaviour increased significantly during the first presentation of the sound, phase D1, compared to before the sound was presented, phase B1. Similarly, this behaviour showed a strong tendency to increase in phase D2 compared to the phase B1. In addition, the Feral Group revealed a significantly higher response compared to the Managed Group. Regarding the type of sound, the Wolf Sound had a significantly stronger effect in Phases D1 and D2 compared to the Control Sound on phase B1.
Table 3: General linear mixed model (GLMM) test for the standing alert behaviour
Trotting/cantering behaviour
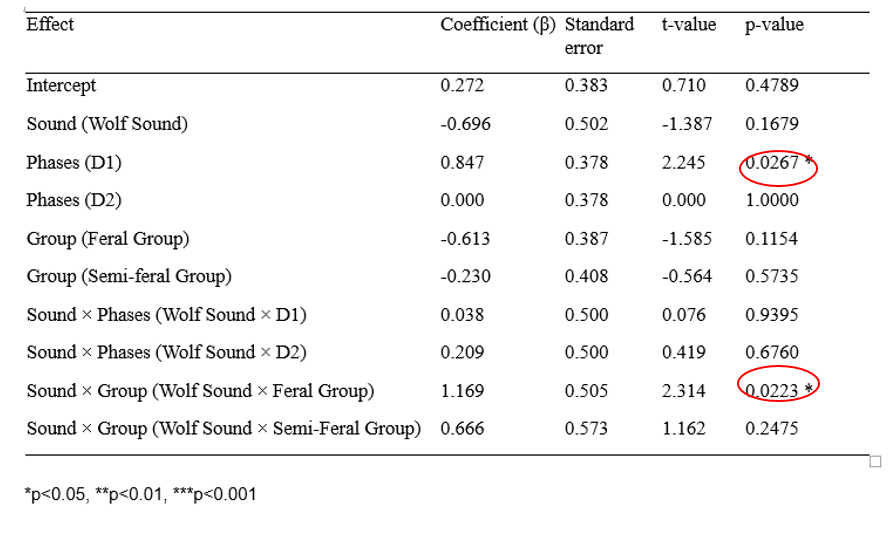
During the first sound presentation, phase D1, the behaviour trotting/cantering increased compared to the phase B1 (β= 0.847, P=0.027) and there was a significant interaction between Wolf Sound and Feral Group (β= 1,169, P=0.0223).
Table 4: General linear mixed model (GLMM) test for the trotting/cantering behaviour
Gathering behaviour
Regarding the Feral Group, the distance “less than one meter” did not differ significantly between the phase B1 and D1 (P=1.0) during the Control Sound. However, the distance tended to differ between the phases during the Wolf Sound (P=0.06)
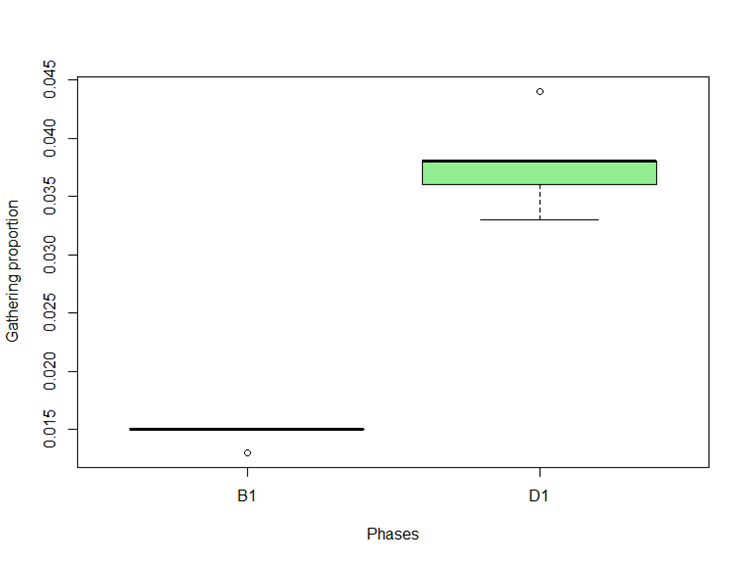
Figure 4: comparison of the two phases, B1 and D1, during the Wolf Sound for the Feral Group. The proportion is calculated as the number of distances less than one meter between two horses divided by the total number of relationships.
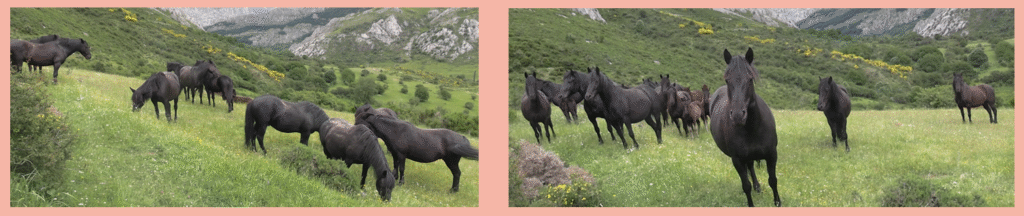
Figure 3: Pictures of the Feral Group before the Wolf Sound (left) and during the Wolf Sound (right)