Species monitoring
In total, there were 1817 individuals from 59 different species. There were 33 Cerambycidae species consisting of 1064 individuals. There were 25 Elateridae species consisting of 740 individuals. For Platypus cylindrus there were 13 individuals found. The Swedish red list cerambycid. No new areas were identified for P. cylindrus, and no signs indicated an increased spread. In total there were six species found that are on the Swedish red list.
| Species | Swedish redlist status | Species | Swedish redlist status |
| Anaglyptus mysticus | NT | Poecilium pusillum | VU |
| Anoplodera sexmaculata | NT | Elater ferrugineus | VU |
| Xylotrechus antilope | NT | Calambus bipustulatus | NT |
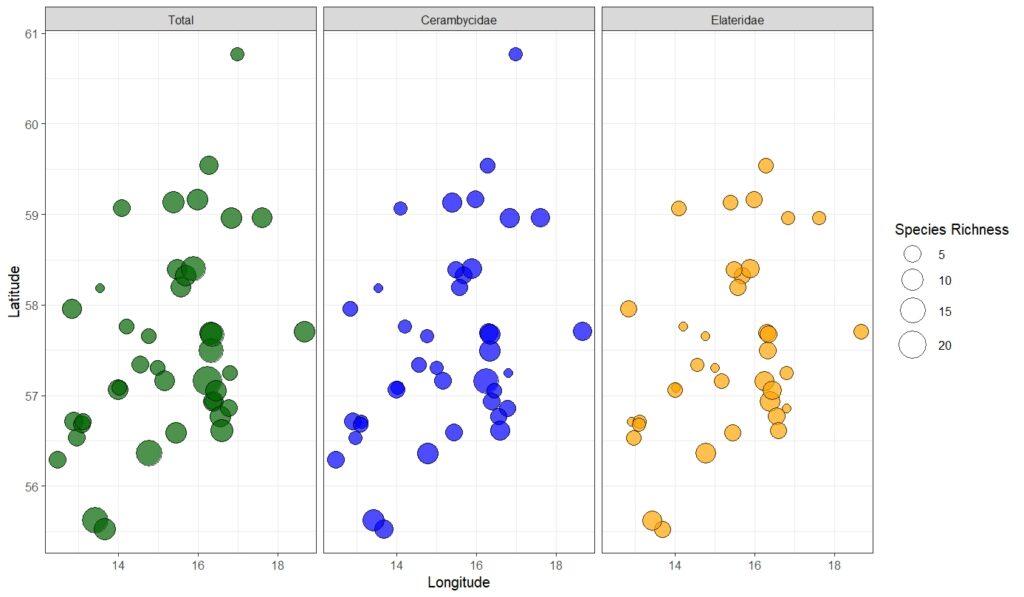
Species richness
The species richness varied across all sites but also across the families. A direct comparison between Cerambycidae and Elateridae species richness across southern Sweden shows that the spread is overall similar. But Cerambycidae beetles were found at higher latitudes and at more sites.
Total species richness tested against quadratic latitude yielded a p-value of 0.110. The same test with only Cerambycid species yielded a p-value of 0.244. Elaterid species richness tested against quadratic latitude yielded a p-value of 0.251. There is a trend though that the number of species decreases with a higher latitude value.
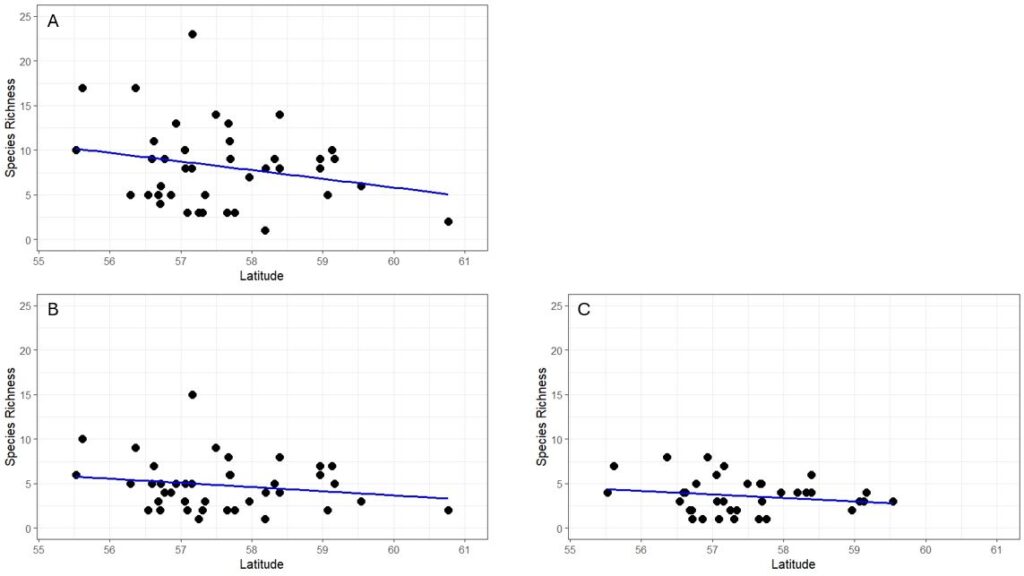
For both beetle families, the species richness is predicted to decrease with higher latitude. The elaterids, though, are predicted to have a slight increase in species richness towards the higher latitudes, while the cerambycid species richness continues to decrease. But for most of the cases, the model did not accurately predict species richness for either of the beetle families.
Interaction matrix
The bipartite network visualisation between Cerambycidae and saproxylic Elateridae is complex and it shows that most species interact with each other. A module heatmap shows that while some species interact more with each other, there are generally interactions between most of the species. The network-level matrix shows roughly 45% of the potential connections exist. The nestedness is significant at roughly 23%. The low H2 value at 0.08 indicates that involved species are generalists. The Nestedness (NODF) value of roughly 31.89 indicates a moderate level of nestedness in this network and supports the first nestedness value. A modularity value of roughly 0.16 indicates a moderate likelihood that this network is divided into distinct modules. The number of distinct communities is 245.
| Connectance | Nestedness | H2 |
| 0.4480 | 23.1573 | 0.0827 |
| Nestedness (NODF) | Modularity | Number of modules |
| 31.8941 | 0.1570 | 245 |
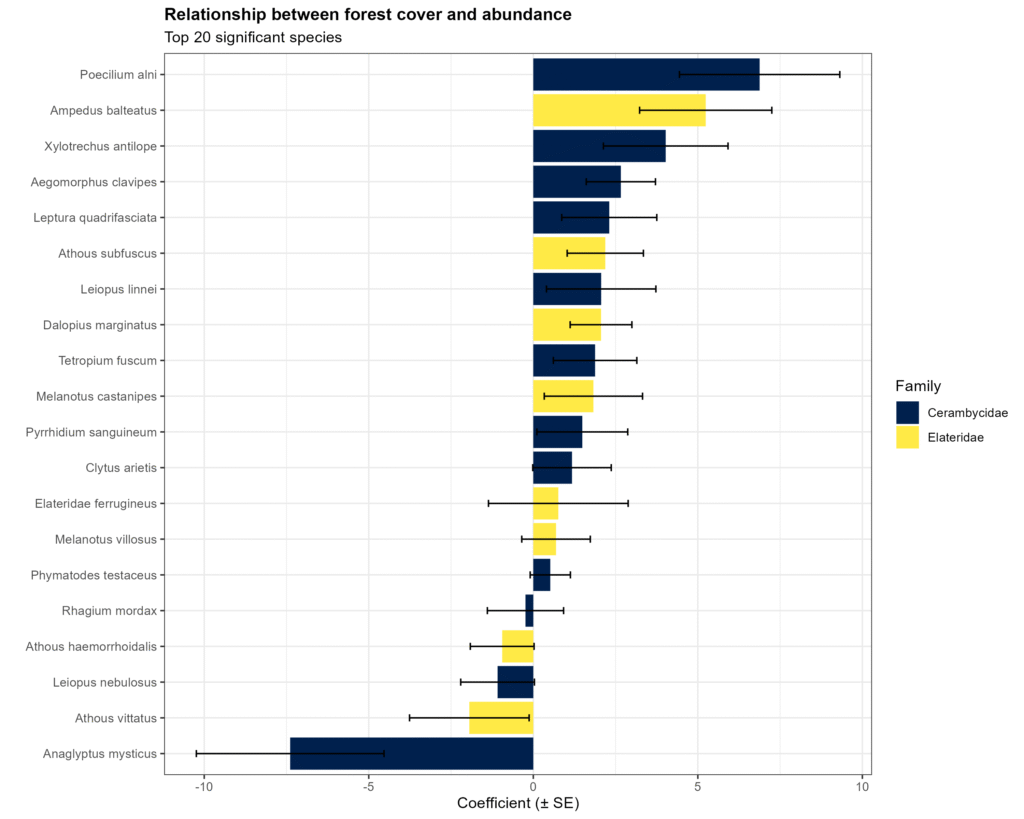
Land cover
Twenty species was tested for land cover effects and revealed that most of them did not have a preference. But six species had a specific and significant relationship to forests, either dependent or avoiding. Most of the species and their abundance seem to be positively affected by forest cover, and only five species had their abundance seemingly negatively affected by forest land cover.
Tree species composition
Statistical significance was found only between species richness per site and the proportion of oaks within buffer zones of 2500 metres or more.
| Buffer size | Deciduous volume | Oak volume | Deciduous proportion | Oak proportion |
| 1000 meters | 0.559 | 0.882 | 0.992 | 0.131 |
| 2500 meters | 0.684 | 0.35 | 0.482 | 0.0454 |
| 5000 meters | 0.394 | 0.197 | 0.281 | 0.0106 |
| 10 000 meters | 0.199 | 0.0615 | 0.0741 | 0.000272 |
Species Identification applications
For Cerambycidae, the amateur achieved the highest accuracy, followed by Artsorakel and Artfakta. In contrast, for Elateridae, Artsorakel was the most accurate, followed by Artfakta.
| Family | Number of individuals | Artfakta accuracy | Artsorakel accuracy | Amateur accuracy |
| Cerambycidae | 62 | 0.242 | 0.532 | 0.984 |
| Elateridae | 57 | 0.298 | 0.316 | – |
Both identification applications suggested more species than what was observed by the expert and amateur. The proportion test for Artfakta gave a p-value of 0.6276, indicating that there is no difference in successful identifications between Cerambycidae and Elateridae. The same test for Artsorakel gave a p-value of 0.02792, indicating that there is a statistical difference in successful identifications between Cerambycidae and Elateridae.