Study species
Longhorned beetles, Cerambycidae
Longhorned beetles, or Cerambycidae, are one of the most diverse and species-rich families, with about 35 000 cerambycids worldwide. Cerambycid species are exclusively phytophagous as larvae but act as pollinators when fully grown. Their lifecycle as larvae commonly begins in either dead or living plants. The habitats of a grown cerambycid vary, but many are found in areas with large amounts of dead wood. Cerambycids have been decreasing in Sweden since the 1950s. One reason is changed forestry practices. Another reason is the decline in deciduous tree forests. Many Swedish Cerambycid species are threatened and on the Swedish red list.
Click beetles, Elateridae
Click beetles, or Elateridae, are a diverse family with about 10 000 species worldwide. They can be found in numerous habitats across the world. Their larvae, known as wireworms, feed on decaying organic matter. The Elateridae, as a family, are also known to be predators of the Cerambycidae beetles. A Swedish Elateridae example is the rusty click beetle (Elater ferrugineus), and it is one of Sweden’s largest click beetles. The species is on the Swedish red list due to a decrease in suitable oak habitats. E. ferrugineus is found across Europe, but it is rare across its range. The species requires deciduous trees for development, such as oaks (Quercus sp.).
The Oak pinhole borer, Platypus Cylindrus
The Oak pinhole borer, or Platypus cylindrus, is a small wood-boring beetle. The species targets weakened or dead trees and does not actively kill them. Primarily oaks (Quercus sp.) are targeted, but other hardwood species may be targeted also. The species degrades the heartwood and may play a part in what is known as “the oak death”. P. cylindrus has recently been found in southern Sweden, after it had been extinct for 70 years. The species is otherwise found across Europe as well and surrounding areas.
Data collection
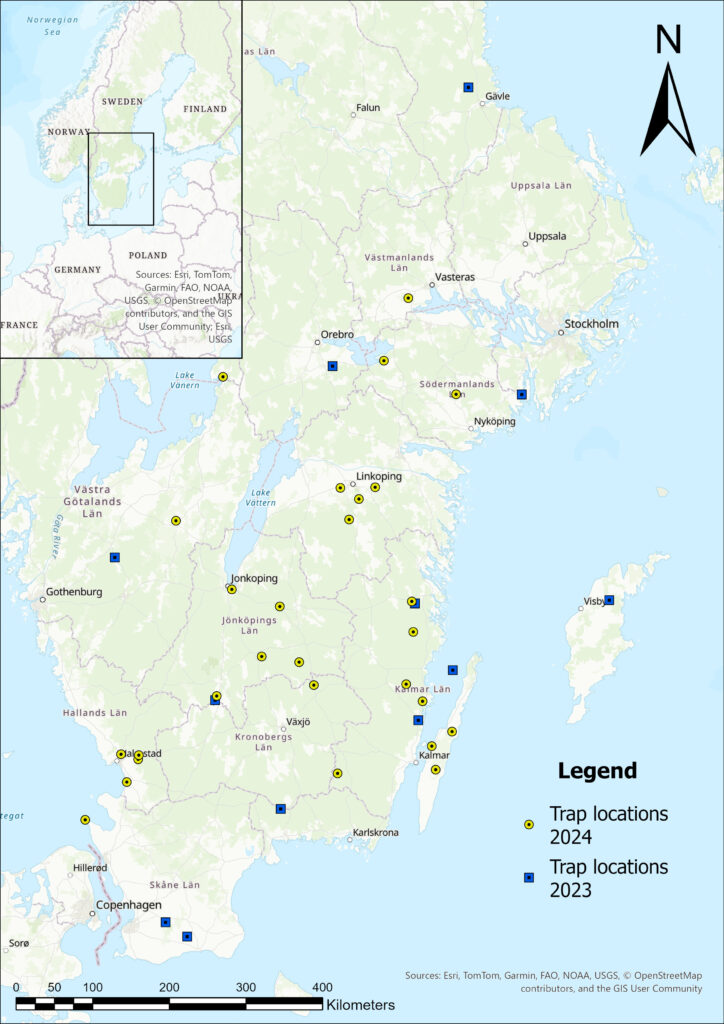
The fieldwork was conducted between the 12th of May 2024 and the 18th of September 2024. During this period, the traps were visited approximately once a month. Twenty-eight pheromone traps were placed out across southern Sweden, from northern Scania to the northern shore of Lake Mälaren. All sites contained oaks (Quercus sp.) to different degrees. Nine different pheromones were used in two different batches. Seven different pheromones for the Cerambycid beetles, one pheromone for E. ferrugineus and one pheromone for P. cylindrus.
Fieldwork
All traps were readied during the second half of May and placed at their respective sites. Pheromones in the first batch were bundled together and attached to the trap. The traps’ location was added in Esri field maps. General visits were conducted between the 24th and 28th of June and the 5th and 9th of August. A new batch of pheromones was placed out between the 8th and 12th of July. The new batch of pheromones added was the same pheromones from earlier but with two new pheromones for P. cylindrus and E. ferrugineus. A short trip visiting the four traps around Linköping, Östergötland, was conducted on the 5th of September to check whether any decomposition had occurred in the traps. Otherwise, this trip followed the same procedure as a general visit. The procedure for the last trip, conducted between the 12th and 18th of September, followed the general trap visit method overall.
Laboratory work
The beetles of interest were separated from the rest of the insects caught. The beetles were checked with the help of a stereo microscope if needed to aid in identification and if possible, was determined directly. The determination for Cerambycid beetles was done mainly with the help of the Swedish national key. Most elaterid species were confirmed by an expert. Once the first step of sorting was completed, any undetermined individuals were checked again using the same resources as earlier. To offer confirmation, all relevant species samples were sent to an expert and to DNA analysis.
To compare species identification application results and an expert, pictures were taken of relevant individuals. All pictures were taken through a stereo microscope with a mobile phone from the top and from the side. All pictures where then run through two species identification applications. Those were “Artfakta” and “Artsorakel”. The photos of each individual were added in pairs, and the corresponding site guess along with the estimated certainty percentage was recorded.
Data analysis
Species richness
Total species richness, cerambycid species richness and elaterid species richness was tested against quadratic latitude with a negative binomial model. The predicted number of species per site for both beetle families was calculated and modelled using a negative binomial model. Regression plots were then generated based on predicted species richness and compared with observed richness. The models for both families were then evaluated. T-tests were conducted to investigated difference in species per site, as well as difference in mean number of species between the two beetle families.
Interaction matrix
The dataset had to be checked so that only saproxylic species remained, i.e. all Cerambycids, but not all the Elaterids. All non-saproxylic species were thus removed from the dataset. A list with all predators (Elaterids) and prey (Cerambycids) per site were created, and all unique species were identified. An interaction matrix was created, followed by a bipartite network. Network-level matrices were then created and examined. A visualisation of the modular structure of the network was also generated, and modularity values and number of modules was retrieved.
Land cover
To see the effect of land cover, categorised data from “Nationella Marktäckedata (NMD)” was used for analysis. A 2500-metre radius buffer zone were generated from each trap, and the ground cover within was extracted. A presence/absence matrix for site and species was generated, and the groundcover data was added to the matrix. All species with a presence over five were included for further testing. A negative binomial GLM function was created to model for each species and species specific data were extracted.
Tree species composition
To examine whether land cover influenced species diversity, tree cover data was downloaded from a database. Four raster files were used: volume of oak trees, volume of deciduous trees, proportion of oak trees and proportion of deciduous trees. It was discovered that the data was faulty outside forested areas, and it was thus cleaned up so that only forests remained. Four different buffer radius sizes were used: 1 Km, 2.5 Km, 5 Km and 10 Km. The total value for each tested factor was extracted and tested against species richness with a negative binomial GLM.
Identification apps
The first step was to check which identifications matched the expert’s identifications and the overall accuracy was summarised for the different. A total count for all distinct species, as well as the total number of suggested species from all sources was also calculated. The second step was to check if the proportion of correctly identified species was the same in both families. A 2-sample test for equality of proportions was thus conducted separately for all unique sources.