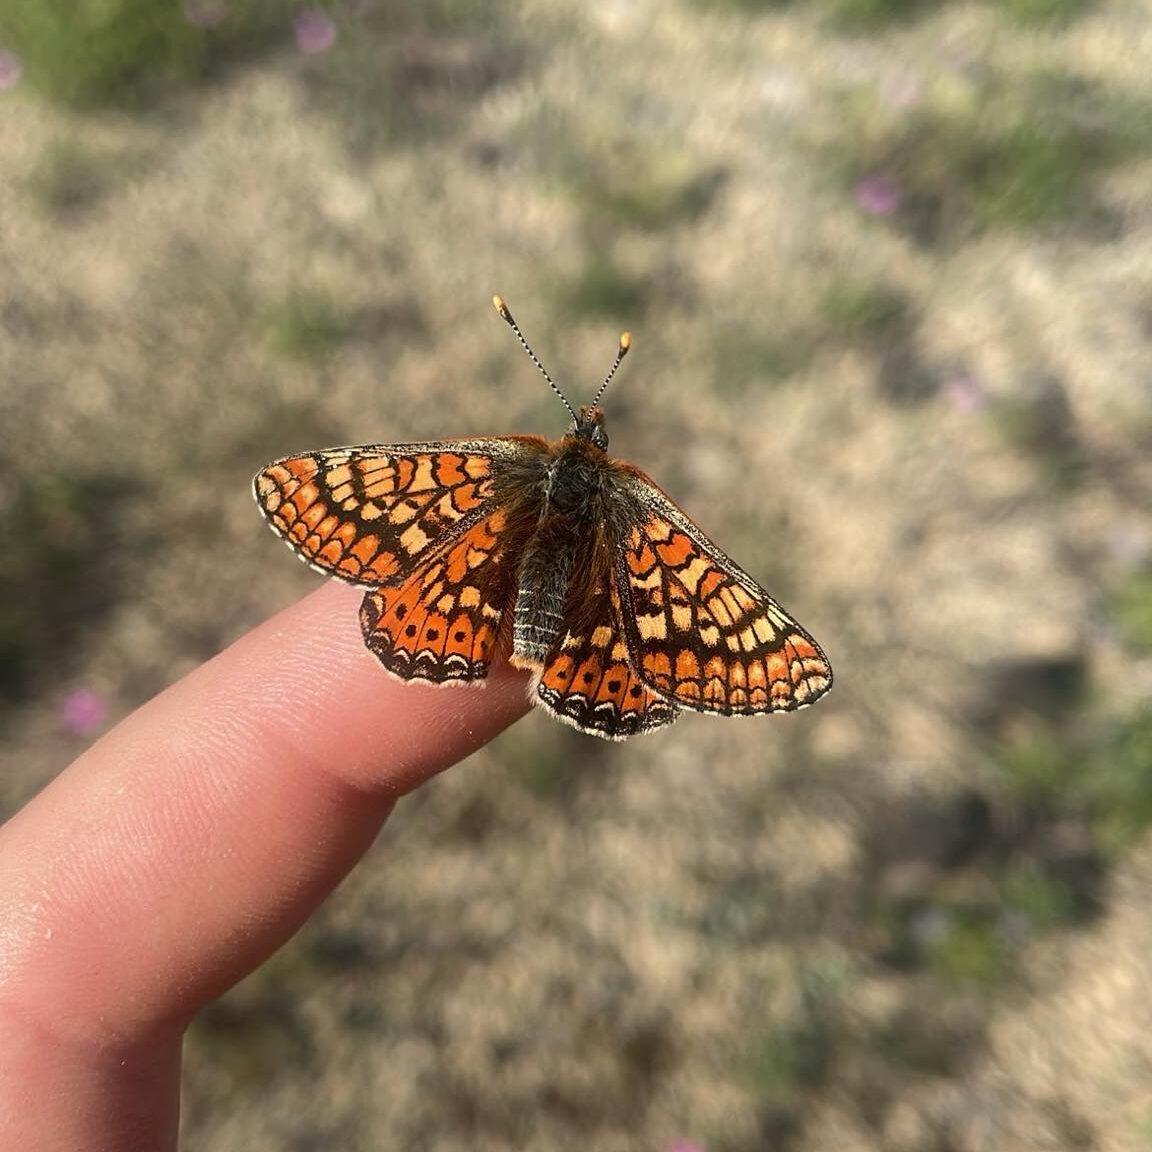
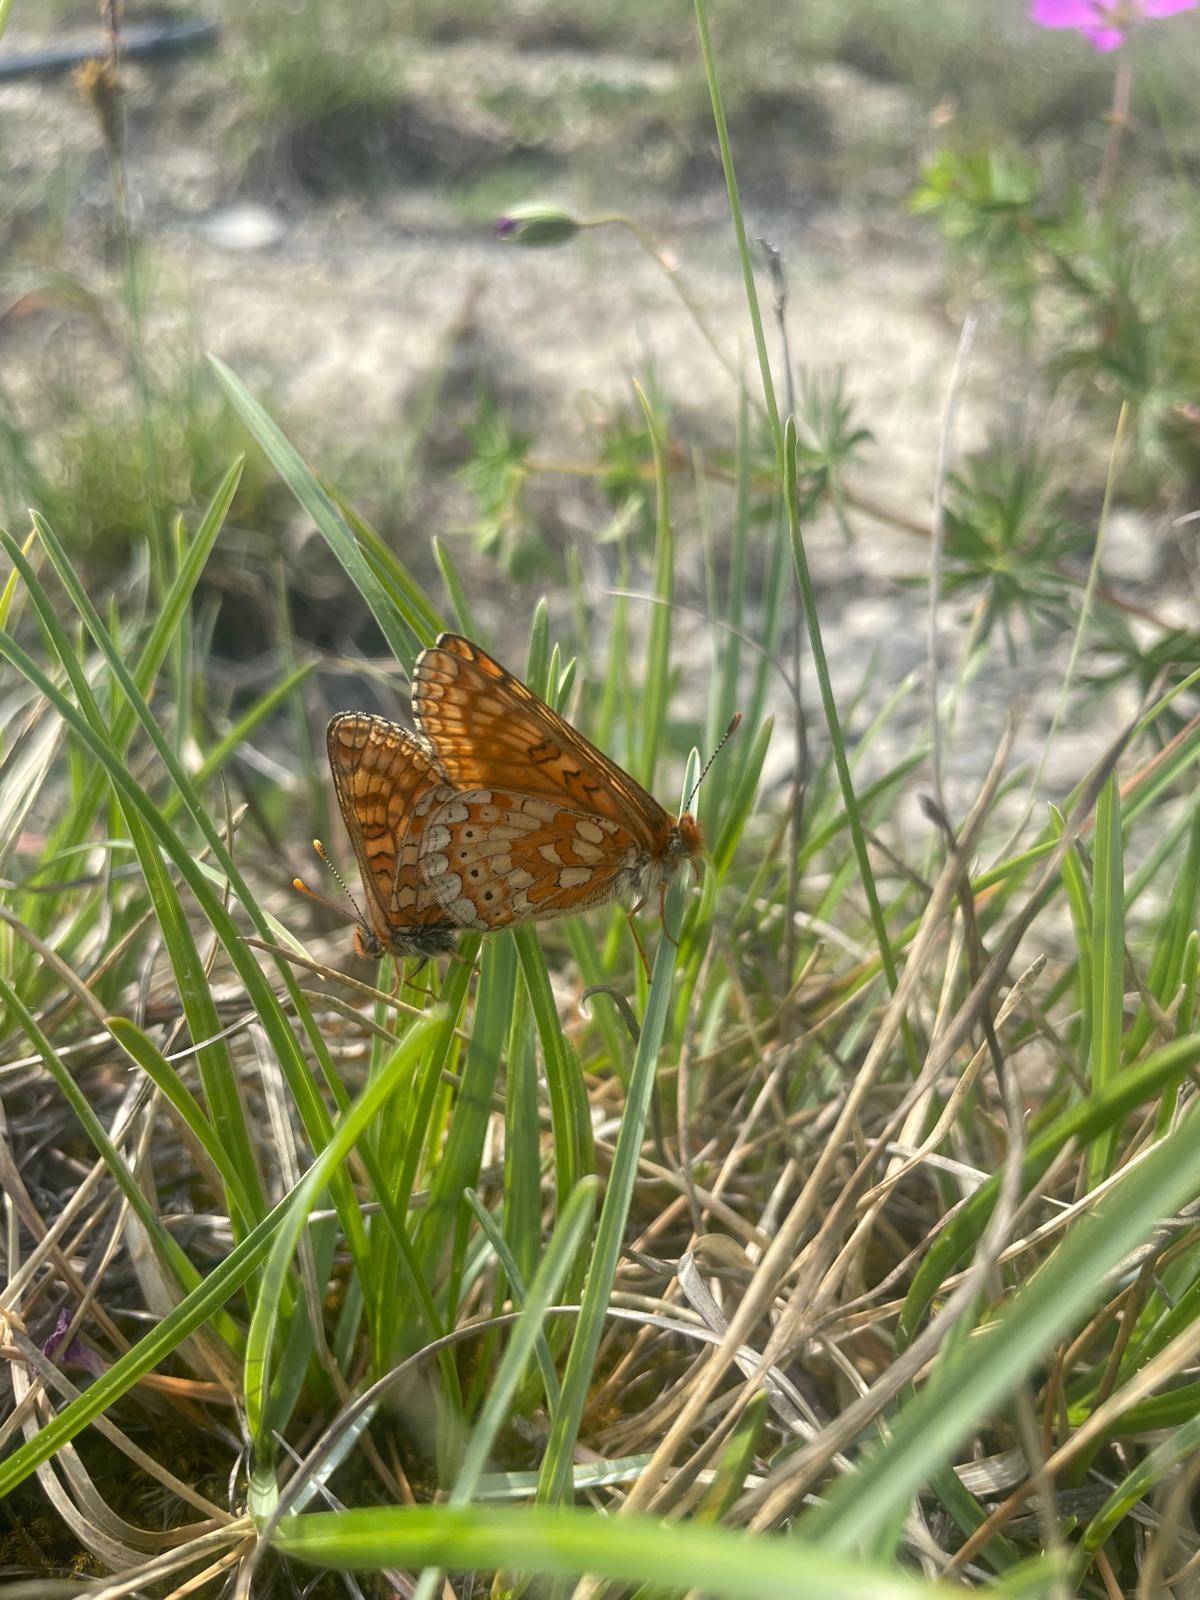
Study Species
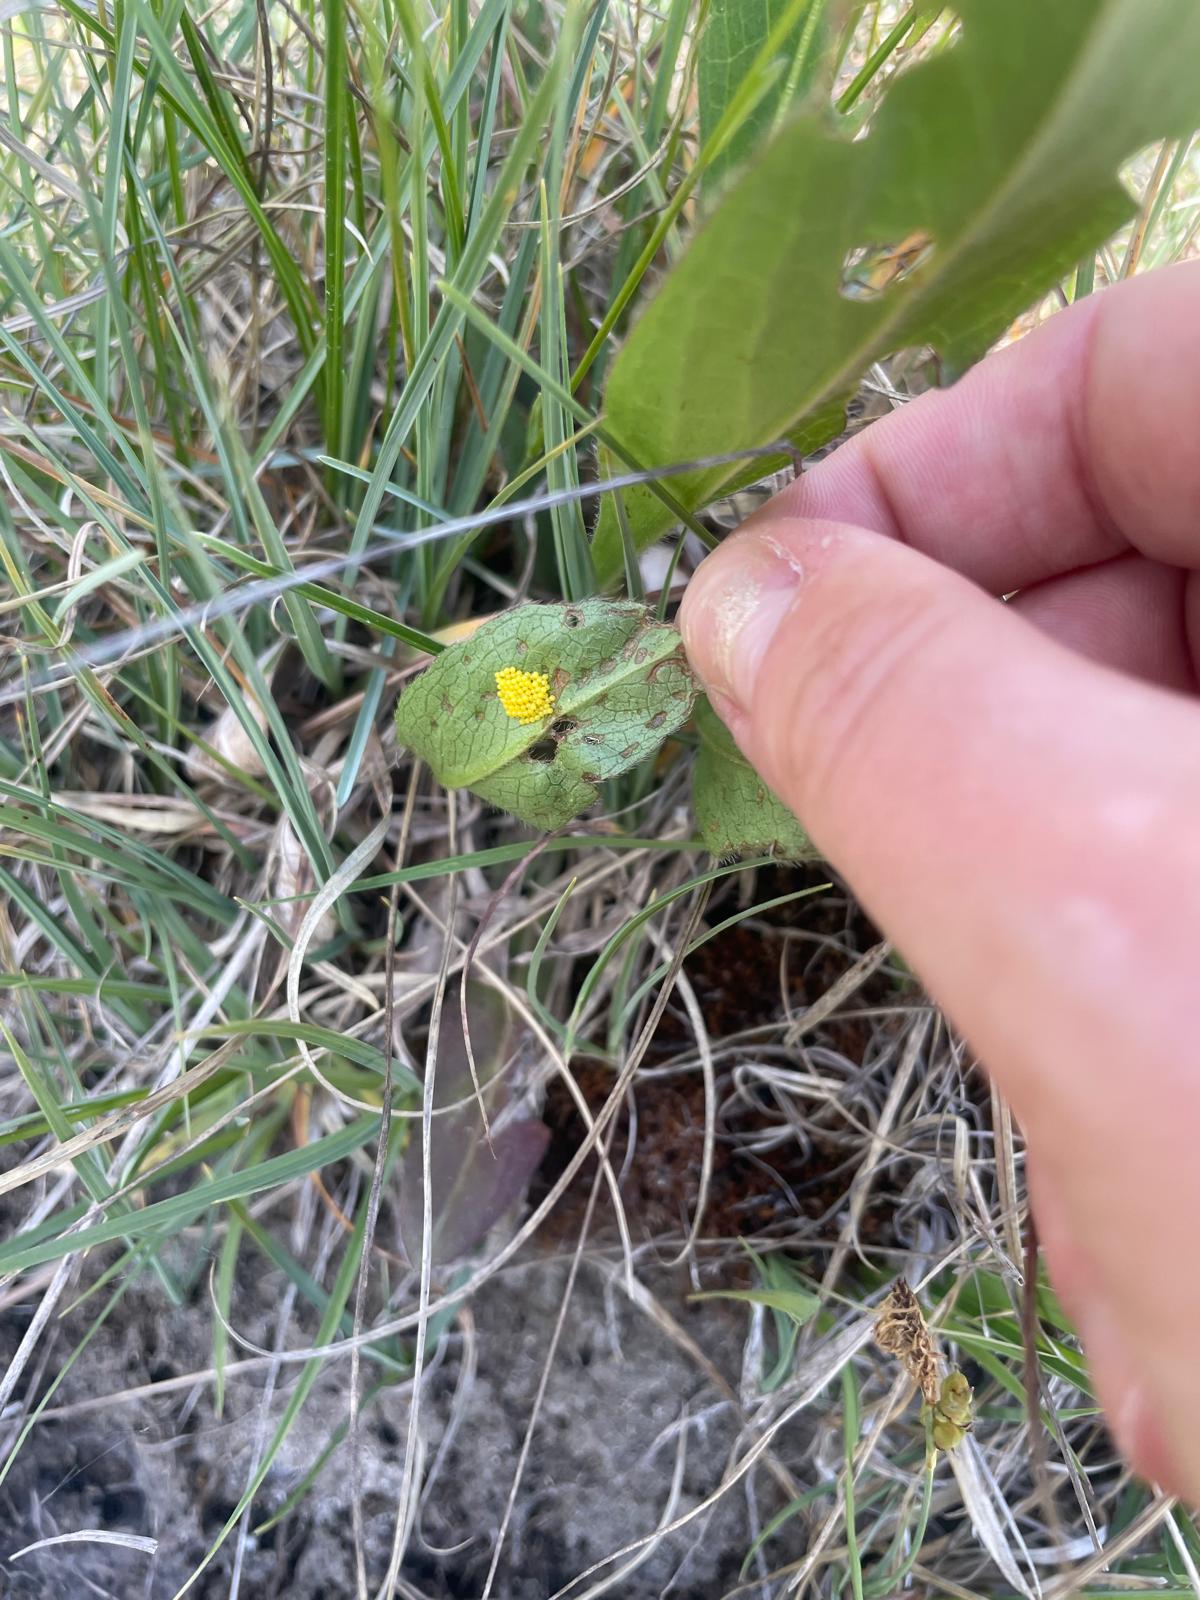
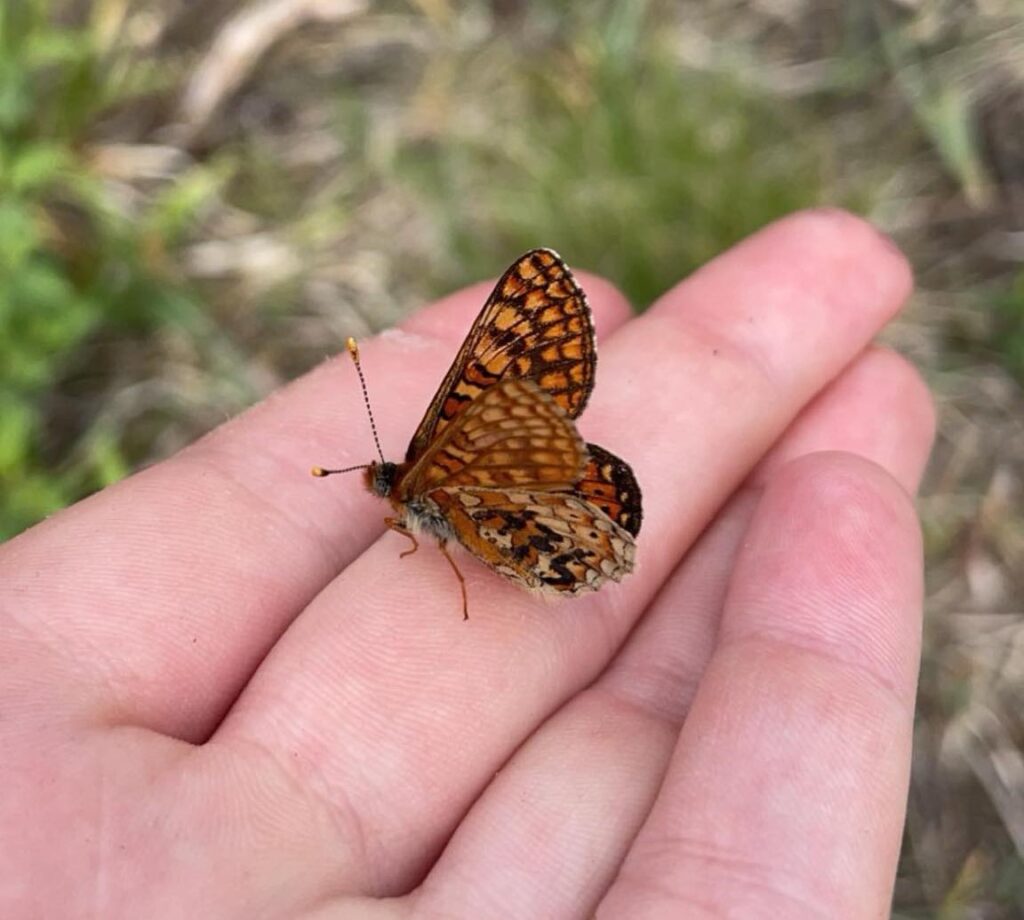
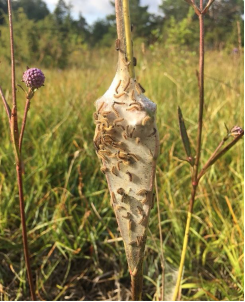
The marsh fritillary (Euphydryas aurinia) is a butterfly species predominantly found in grassland habitats. It exhibits a preference for open, semi-moist grasslands characterized by low vegetation density. The flight period typically spans from late May to the end of June, though annual variations may occur due to fluctuations in weather and temperature. Males generally emerge before females. Upon emergence, females carry a clutch of eggs, which they deposit collectively on the underside of leaves of their host plant, devil’s-bit scabious (Succisa pratensis), after mating. The larvae hatch in late summer, constructing protective nests around the host plant. They enter diapause within these nests during the winter months, and resume their activity again in early spring (Norman et al., 2024). Given their reliance on S. pratensis, the marsh fritillary population is particularly vulnerable to climatic changes that may adversely affect the availability and distribution of their host plant.
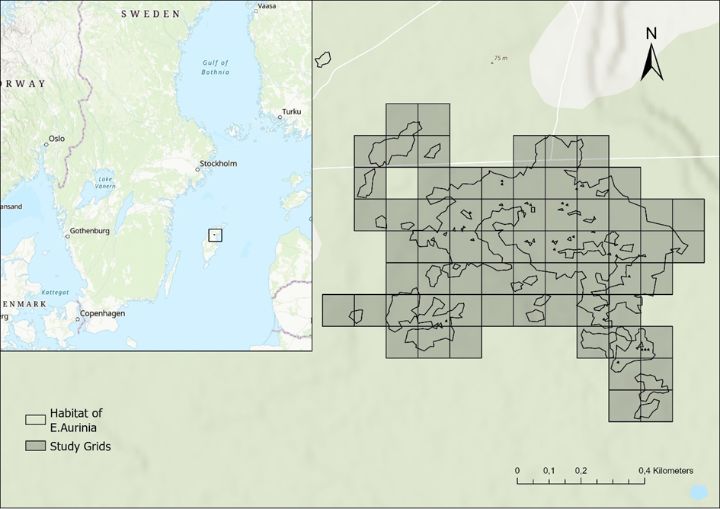
Study Area
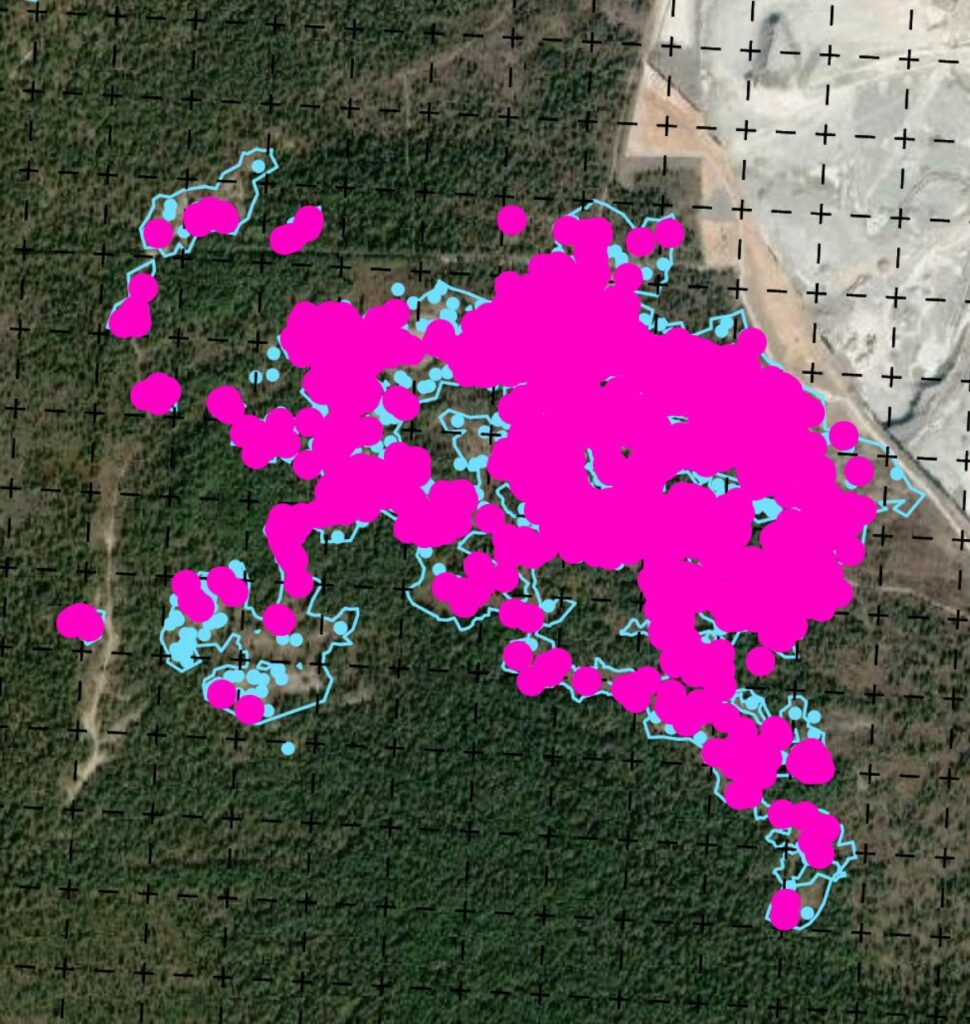
The data collection was performed across 66 1×1 hectare grid squares in the area of File Hajdar on northeastern Gotland, Sweden. The adult butterfly population in this area has been continuously studied every year since 2017 and the larvae nests since 2016. The landscape comprises primarily open areas with lower shrubs and grasses, interspersed with some higher growth vegetation, creating a mosaic of microhabitats with varying temperature, moisture, and vegetation characteristics.
Data Collection
Statistical Analysis
Primary data collection for adult marsh fritillaries was conducted using a capture-mark-recapture (CMR) methodology during the summer of 2024. This collection encompassed the entire flight period of the species, from late May to the end of June.
Throughout the flight period, all grids were surveyed daily, except on days with continuous rainfall. Captured individuals were marked with a unique identifier, comprising a letter and a number. Sex, location, identification code, and the observed behavior at the time of capture were recorded using the FieldMaps App . To minimize sampling bias, the grids were visited at varying times of day, with different routes employed daily throughout the study period.
During the fall of 2024 , a complete inventory of the larvae nests in the area was conducted. Each grid square was systematically searched for larval webs, which are most visible during this period. The location of each nest was recorded using GPS coordinates, and all nests within each grid were counted to estimate total larvae abundance.
The collected data was compiled with data from previous years’ studies (2016-2023). For each hectare grid square, background characteristics from raster data such as ground moisture, tree/bush cover, and vegetation height were extracted, calculating the minimum, maximum, and mean values for each environmental variable.
Population size estimates for adult butterflies were derived from the CMR data. For larvae, population estimates were based on direct nest counts. Both annual population trends and the persistence of inhabitation (number of years each grid was occupied) were calculated for both adults and larvae.
To examine population dynamics, the correlation between adult population size in summer and larvae nest abundance in fall was analyzed, as well as the relationship between larvae abundance and the following year’s adult population. The effects of climate variables (precipitation and temperature) on both life stages were also investigated using generalized regression models.
The relationship between habitat characteristics and larval persistence was analyzed using generalized linear models (GLM) with Poisson distribution . The response variable was the number of years each grid square was inhabited by larvae, with ground temperature, moisture, and bush cover as predictor variables.
For adult butterflies, peak abundance patterns were analyzed using negative binomial GLM to account for overdispersion in count data. The response variable was the sum peak butterfly count in each grid, with the same environmental predictors as in the larval model. Peak butterfly activity was determined by analyzing daily count data across multiple years, selecting the day with the maximum observed count for each grid and year.
All statistical analyses were performed using R, with the MASS package employed for negative binomial regression models. Spatial data management and visualization were conducted using ArcGIS Pro 3.4.0.