Optogenetic dopamine self-stimulation
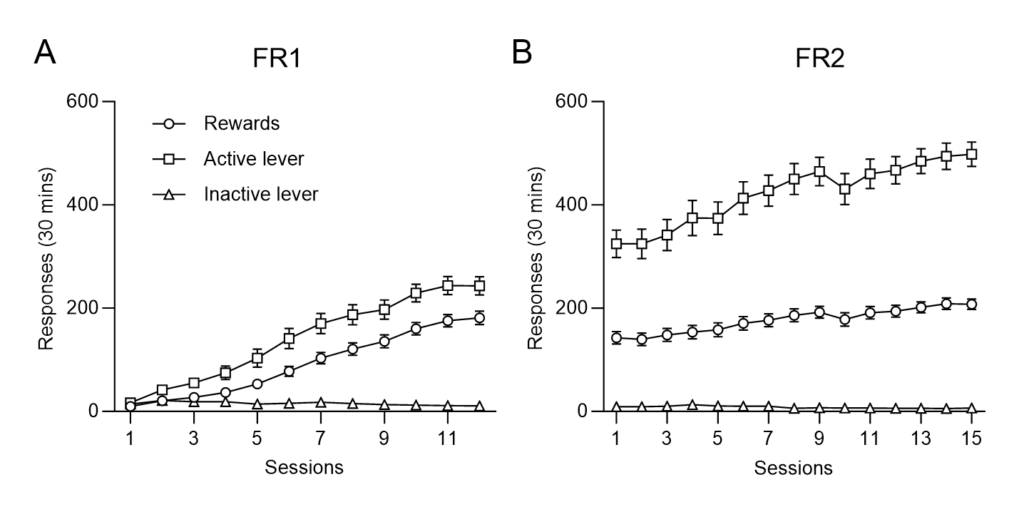
Rats quickly learned to press the lever and receive a reward. When FR2 was implemented, the average number of rewards granted per session initially decreased, reflecting the increased effort needed to obtain a reward. The rate of lever pressing gradually increased back to baseline and the number of rewards previously granted during FR1 was re-established, as the rats got accustomed to the new requirement for receiving stimulation.
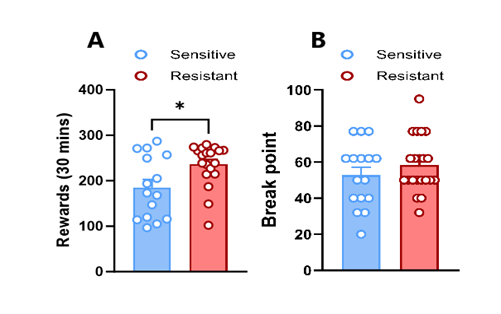
Progressive ratio
Punishment-resistant animals showed a significantly higher number of baseline unpunished rewards than punishment-sensitive rats (t(32) = 2.58, p < 0.05) however, punishment-resistant rats did not show a significant difference (t(35) = 1.01, p = 0.32, unpaired t-test) in break point in PR, and index of motivation to obtain optogenetic self-stimulation compared to sensitive rats.
Punished optogenetic dopamine self-stimulation
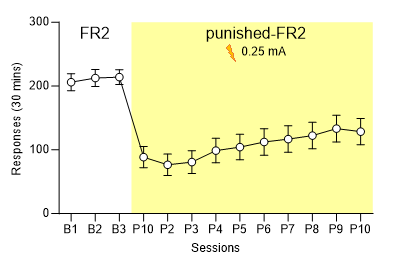
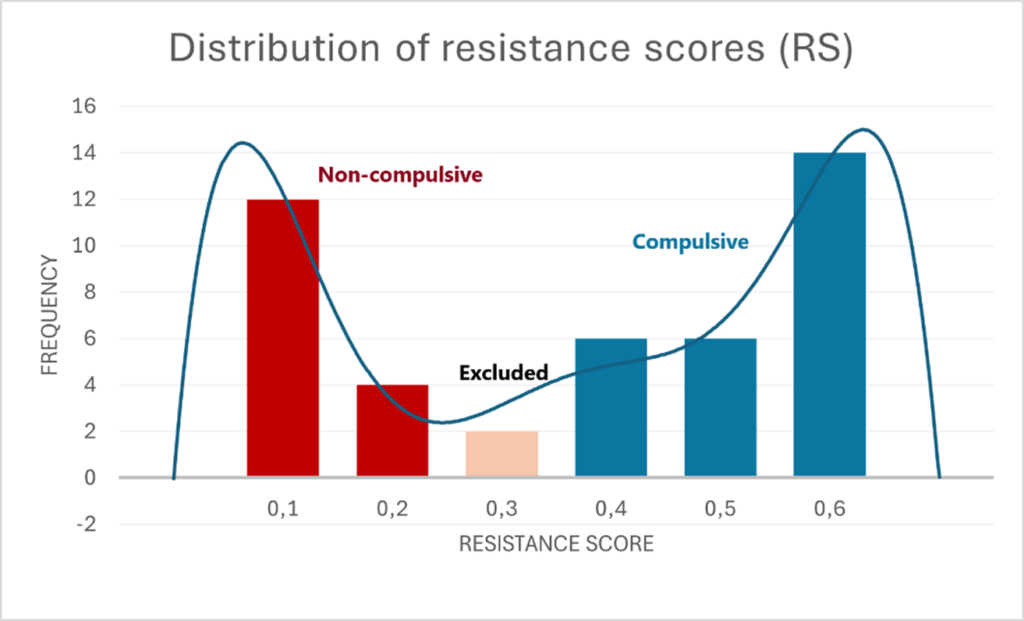
The addition of the foot shock caused stimulation rates to decrease drastically, with marked individual difference in the re-establishment of the self-stimulation behaviour. In some rats, a strong suppression of lever pressing could be observed, while some continued to press to a similar extent as during unpunished sessions. The rats with marked lever pressing suppression were deemed sensitive to punishment (non-compulsive), while the group that maintained baseline lever pressing levels was deemed resistant to punishment (compulsive). This was the basis for the calculation of resistance scores (RS), which was done by dividing the number of lever presses during punished oDASS (nP) by the sum of the number of punished lever presses and baseline (non-punished) lever presses (nB). This resulted in a score < 0.5 for animals that achieved fewer rewards during punished optogenetic self-stimulation, and a score of ≥ 0.5 for those that obtained the same or higher number of rewards when moved to punished optogenetic self-stimulation. The obtained resistance scores were used to divide rats into two groups, those above 0.30 were deemed compulsive, and those below 0.20 non-compulsive; the remaining rats were considered an unidentified phenotype and excluded from further analysis.
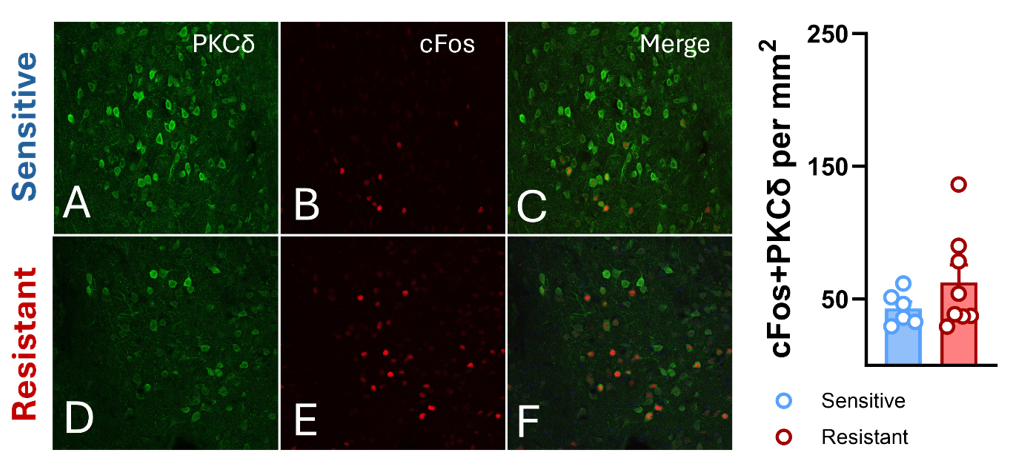
Microscopy image analysis
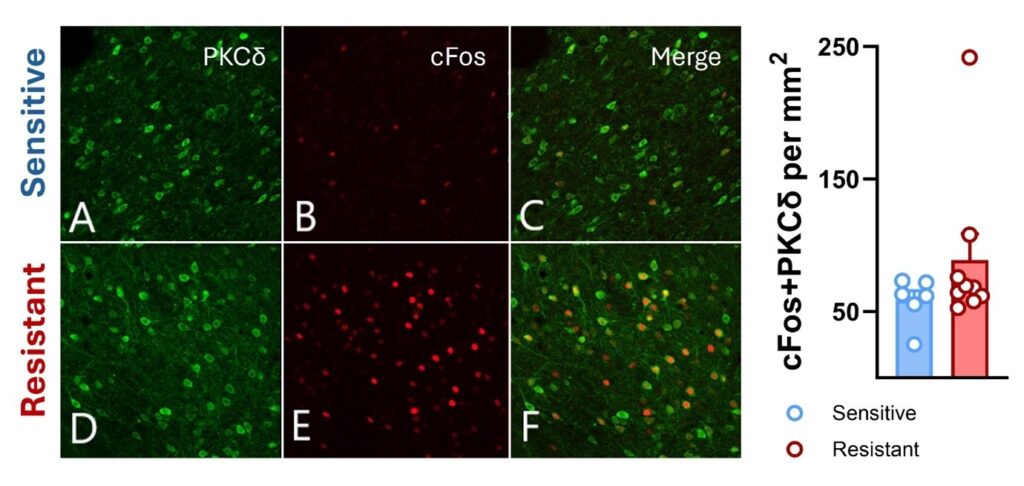
The data show a non-significant trend toward an increased c-Fos-expression in CeA PKCδ neurons (t(13) = 1.20, p = 0.25, unpaired t-test). A similar pattern was observed in BNST PKCδ neurons (t(13) = 1.25, p = 0.24, unpaired t-test).