Animals and housing
47 adult male Wistar rats were used in the experiment. Outside of the experiment, animals were housed in groups of four per cage, with controlled conditions, such as temperature (21˚C), humidity levels (<40% relative humidity) and a 12-hour reversed light cycle. Food pellets and water were available ad libitum, along with enrichment items such as chewing sticks and cardboard rolls for shelter.

Viral injections and optic fibre implantation
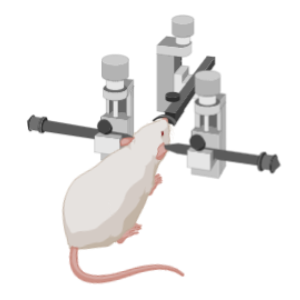
In order to make optogenetic dopamine self-stimulation possible, the animals’ brains needed to be surgically modified. This was achieved through injecting two viral vectors to selectively express channelrhodopsin (ChR2) in the dopaminergic VTA neurons, which enabled the activation of the dopaminergic neurons in the VTA during blue light stimulation. To make it possible for blue light to reach these neurons, an optic fibre was implanted above the VTA, anchored into the skull with screws, and secured using black dental cement.

Optogenetic dopamine self-stimulation
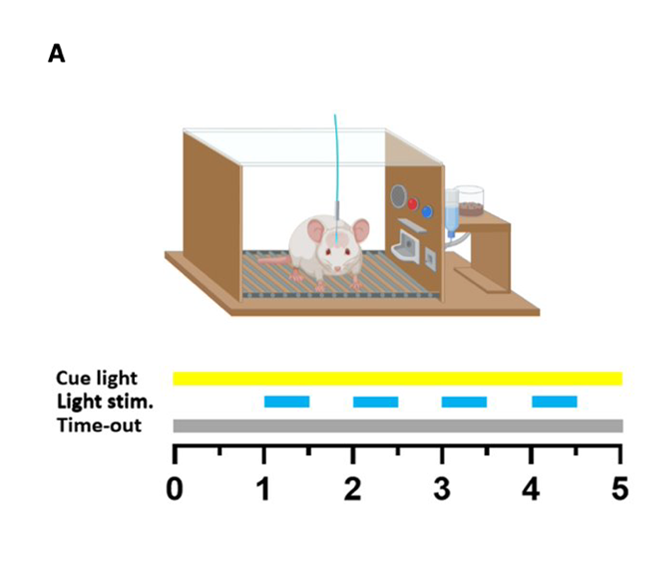
The rats were placed into operant conditioning chambers where they were able to press a lever which activated a cycle; the cycle consisted of a one second delay, followed by four seconds of blue light stimulation to the dopaminergic VTA neurons. The experiment was first conducted using a fixed ratio 1 (FR1) schedule, meaning that one lever press led to a reward, until the number of lever presses became stabilized across sessions, at which point an FR2 schedule (two lever presses necessary for reward) was implemented. Upon the implementation of FR2, the number of rewards granted initially sharply declined, but returned to FR1 levels once the animals learned the new requirements. Once the number of FR2 presses stabilised, a punished model could be implemented.
Punished optogenetic dopamine self-stimulation
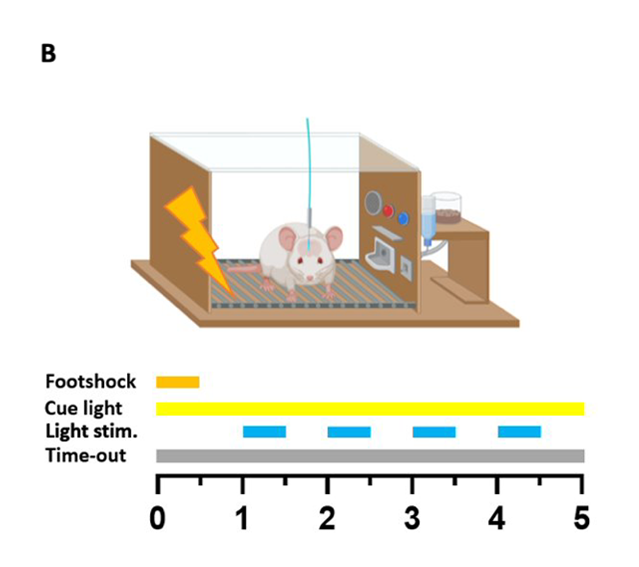
Following stabilisation of performance under an FR2 schedule, a chance to receive a 0.25 mA foot shock along with the dopamine reward was added. The shock lasted 0.5 seconds and occurred immediately after completion of an FR2 cycle. The implementation of punished optogenetic dopamine self-stimulation was followed by a steep drop in the average number of rewards obtained, with only a fraction of the rats returning to consistent pressing. The remaining rats drastically decreased their number of lever presser per session, or completely stopped pressing. This was the basis for the two groups observed in the study – punishment resistant (compulsive) animals, and punishment sensitive (non-compulsive) ones.
Progressive ratio
To quantify the rats’ motivation to self-stimulate, a progressive ratio (PR) test
was concluded. In this test, rats could choose to self-stimulate in the same
way as the previous experiments, but after each reward was granted, the requirement
was increased following the ratio calculated from the formula below. The number of presses necessary for one reward thus followed the ratio 1, 2, 4, 6, 9, 12, 15, 20, 25, 32, 40, 50, 62, 77, 95, 118, 145, 178, 219… The session ended 30 minutes after the last reward
granted, and after each reward was delivered, the 30-minute timer restarted.

Brain processing – perfusion, slicing, immunohistochemistry, and microscopy
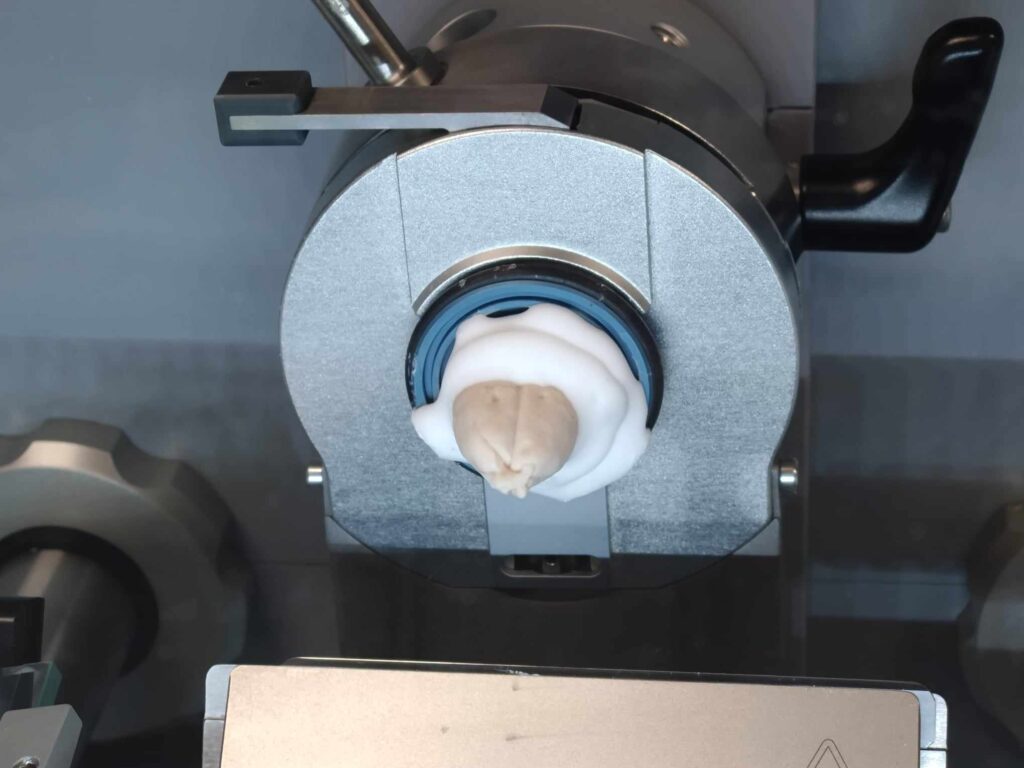
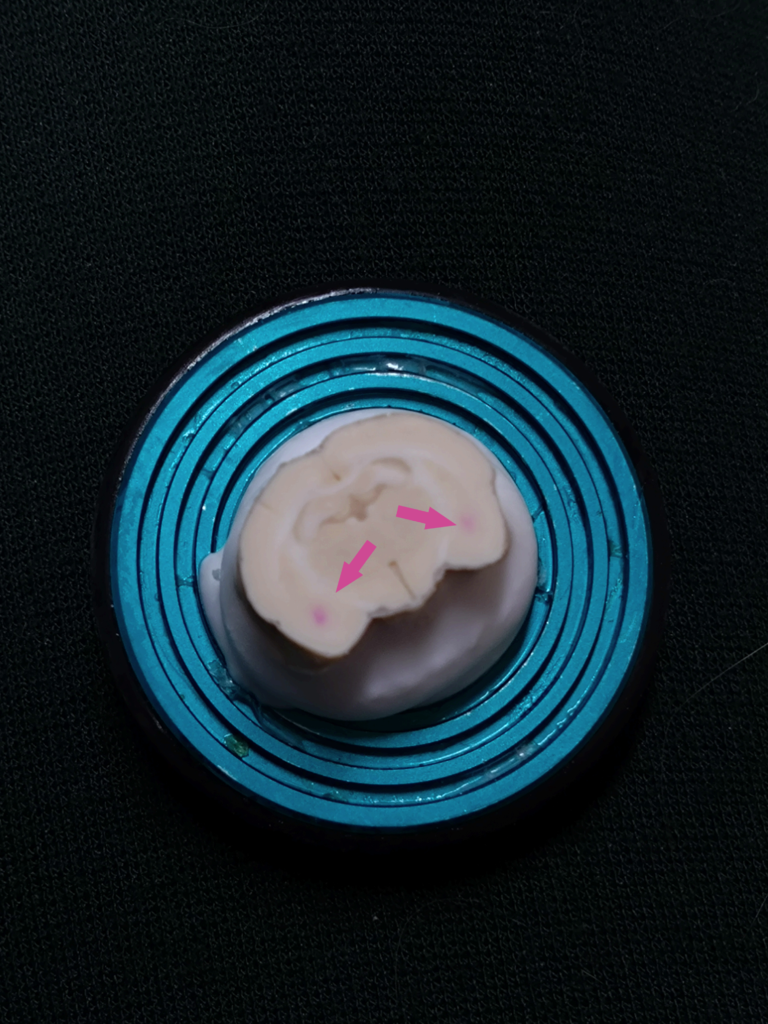
90 minutes after the beginning of their last punished self-stimulation session, animals were euthanised. The brains of the animals were perfused with 4% paraformaldehyde (PFA) to preserve cell and tissue structure, and then extracted for the purpose of slicing. After postfixing in PFA, the brains were sliced at -20˚C in a cryostat-microtome to prepare slides for immunohistochemistry and microscopy.
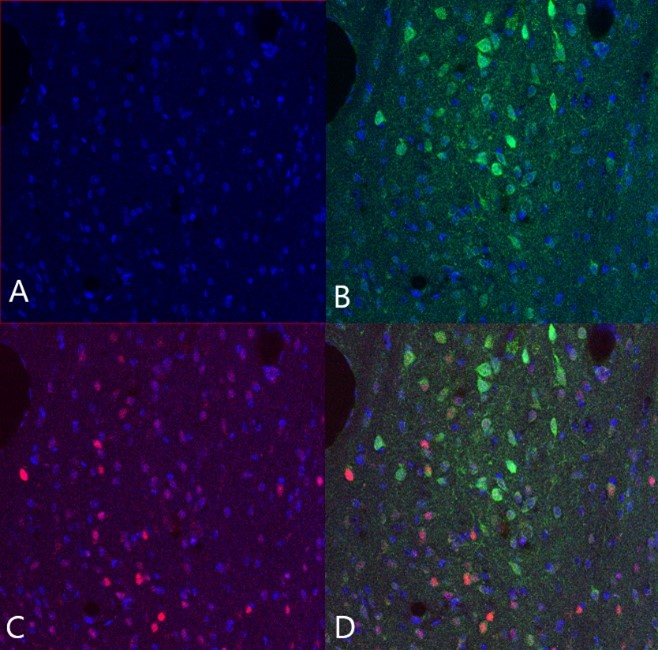
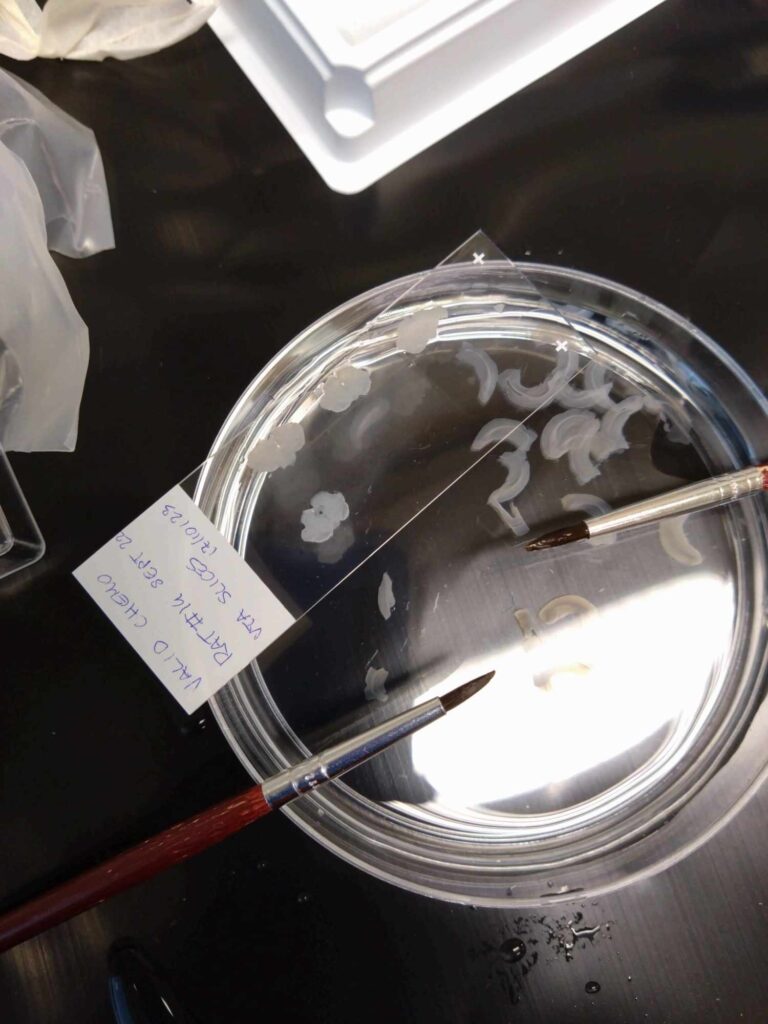
The obtained amygdala and BNST slices were saved for an immunoassay measuring c-Fos levels in the PKCδ neurons of the amygdala and BNST. C-Fos is a protein produced rapidly following neuronal activation, and is therefore often used as a molecular marker of neuronal activity. This means that if the PKCδ neurons had been activated prior to euthanasia, higher c-Fos levels would be observed in compulsive than in non-compulsive animals.
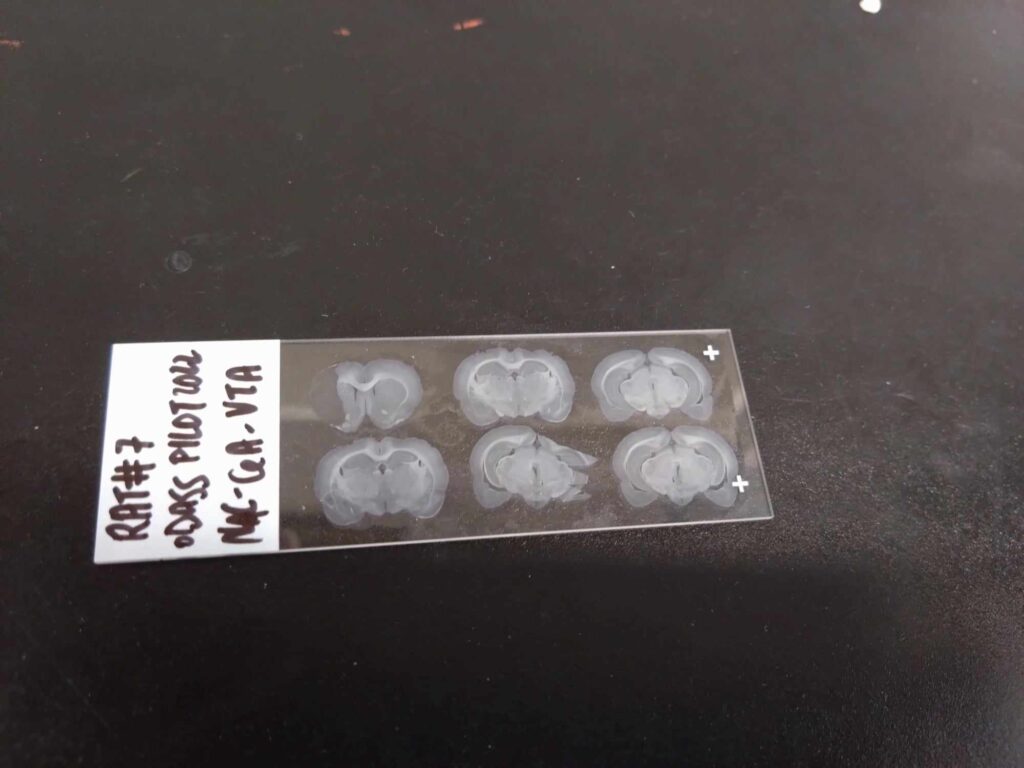
After the c-Fos immunoassay, slices were mounted on slides for fluorescence microscopy. Finally, slices were stained with DAPI, a fluorescent stain typically used to stain the cell nucleus for fluorescence microscopy. Slides were observed under a LSM800 Zeiss confocal fluorescence microscope, and images of relevant areas were saved as a .czi file for image analysis in QuPath.
Microscopy image analysis
Microscopy images of the amygdala and BNST were analysed in the software QuPath. Since the aim of the study was to compare the activation of the amygdala PKCδ neurons in compulsive and non-compulsive individuals using c-Fos as a proxy, the total number of PKCδ neurons, the total number of neurons containing c-Fos, and the overlap (total number of PKCδ neurons containing c-Fos) were determined for each slice.
This process was repeated for all of the microscopy images (six amygdala slices and six BNST slices per animal) and the results were exported into an Excel spreadsheet for statistical analysis.
A two-tailed t-test was used to compare the two groups (compulsive and non-compulsive rats).