Food habits:
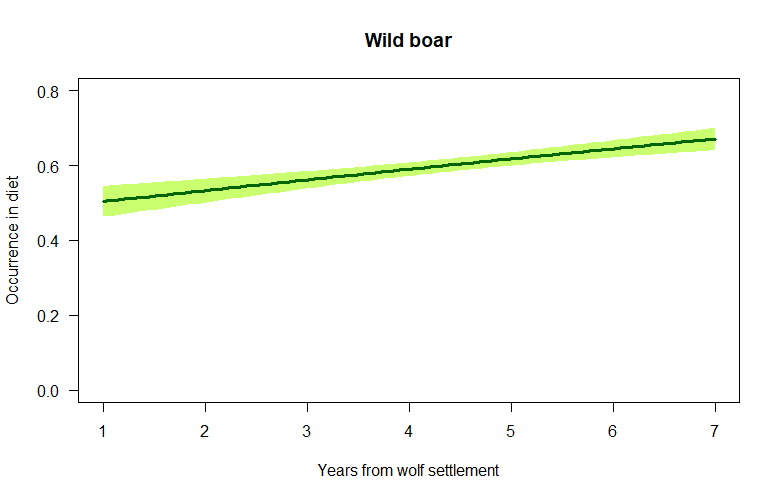
The proportion of fallow deer in the wolf diet went down, and wild boar (see graph on the left) went up. This should have triggered and anti-predatory behavioural change in our study species.
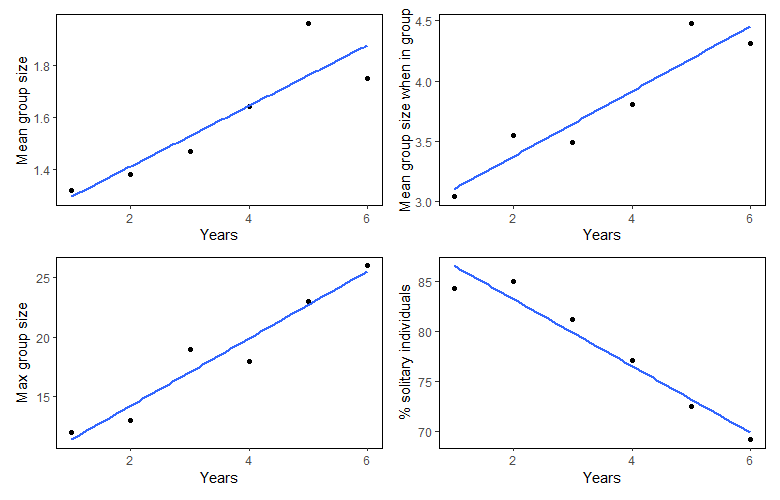
Group size variations:
We can see an increase of mean group size, mean group size excluding the solitary individuals’ detections, and of maximum group size. We also observe a decrease of the % of detections of solitary individuals.
Confoundings factors:
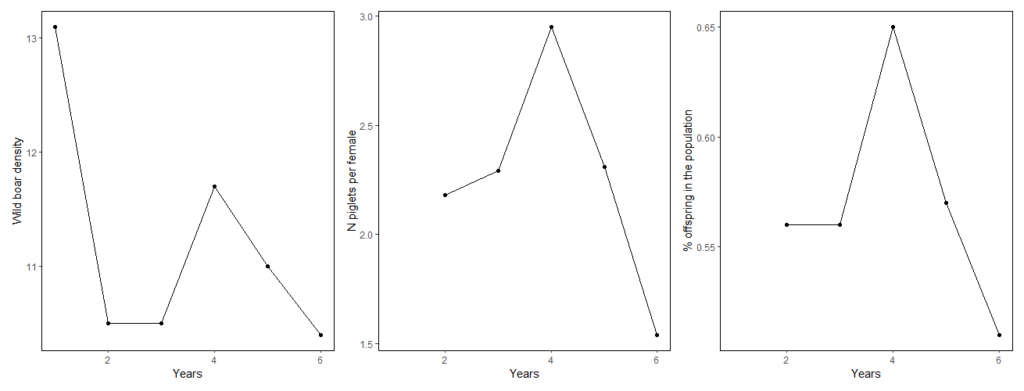
Population variables:
We see no significant changes regarding our first confounding factors: population variables. Indeed, density, number of piglets per female and the % of offspring in the population are all consistent during my study.
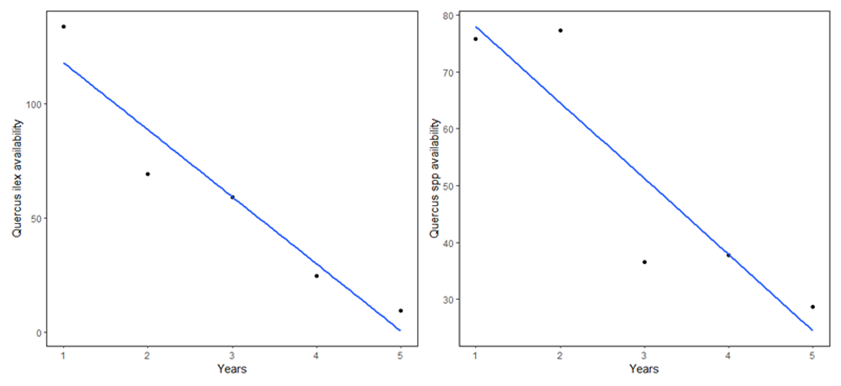
Food availability:
Second confounding variable, we can see a decrease of food availability in our area.
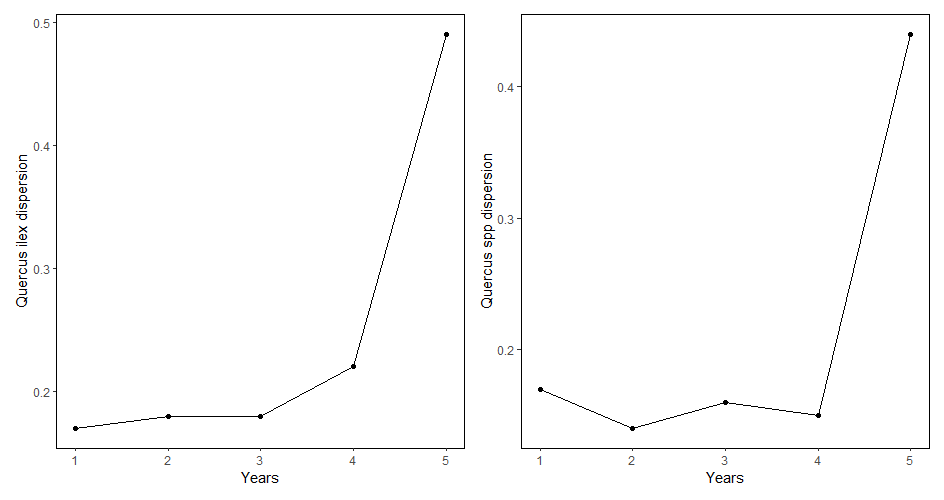
Food dispersion:
Linked to the previous graph, we see no significant changes regarding food dispersion, meaning no bigger patches of food located in the same spots.
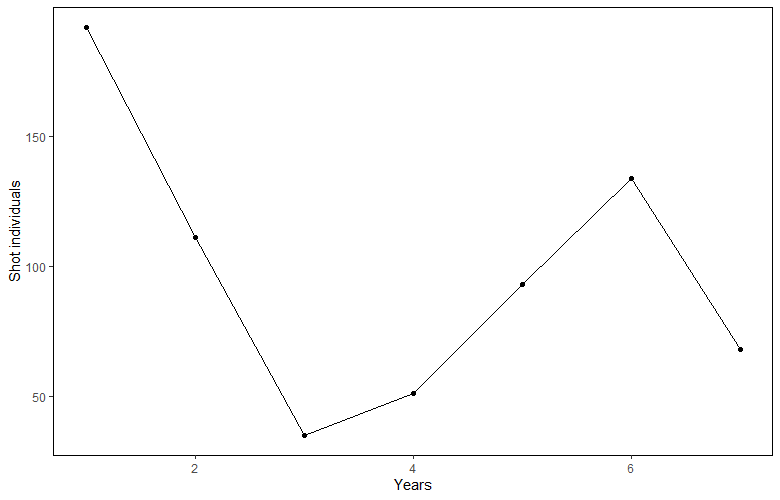
Culling:
Last confounding variable, we see no significant changes in the number of individuals shot in the last 7 years.
Generalised linear mixed models
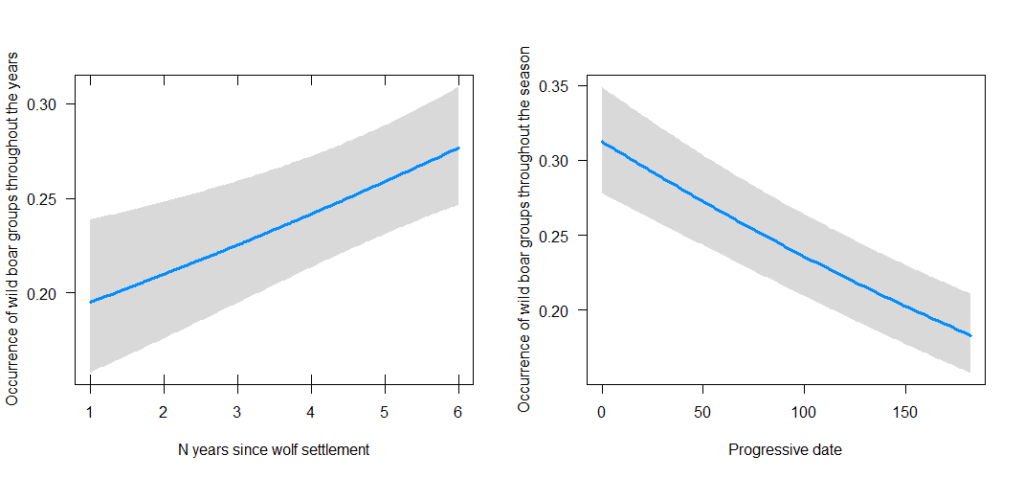
First glmm analysis: group ratio
We observe an increase of the group ratio with years, meaning more groups or less solitary individuals’ detections the more time passes. We also observe a decrease of this ratio with progressive date, so throughout the season, which can be explain by predation or others causes of mortality leading small groups to become solitary.
There was no significance of habitat type or wolf activity.
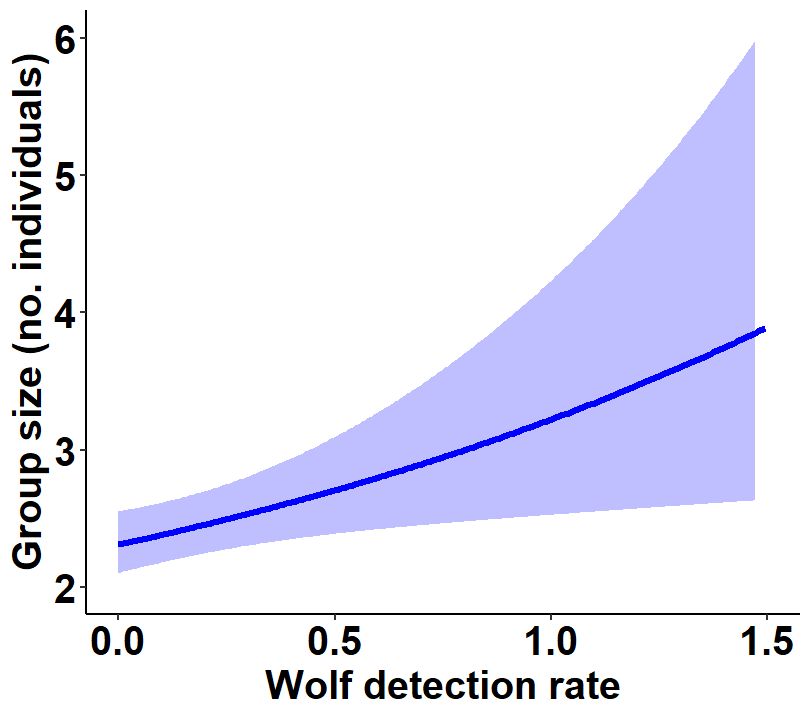
Second glmm analysis: group size
The significant increase of mean group size with years was confirmed by this analysis, but the most interesting results is in the fact that mean group size increased with a higher wolf activity (see graph on the right).