The results will be presented according to the different perspectives mentioned in the methods section. The percentages on all of the figures below show the proportion of time spent on a behavior during the time of observation and the error bars represent standard error.
High season vs. low season
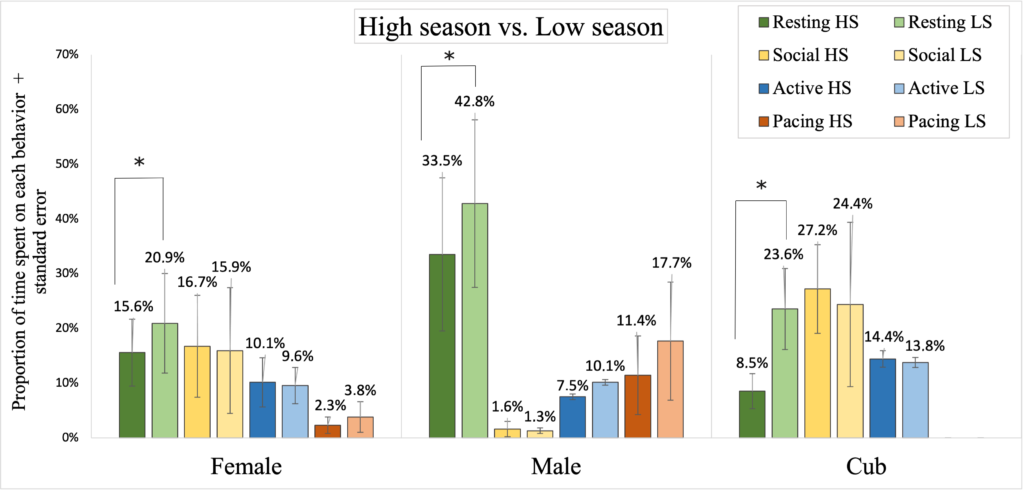
These graphs are comparing High season (27th June- 17th of August) to Low season (25th September – 23rd November).
For illustrational purposes, males, females and cubs are combined into their own groups.
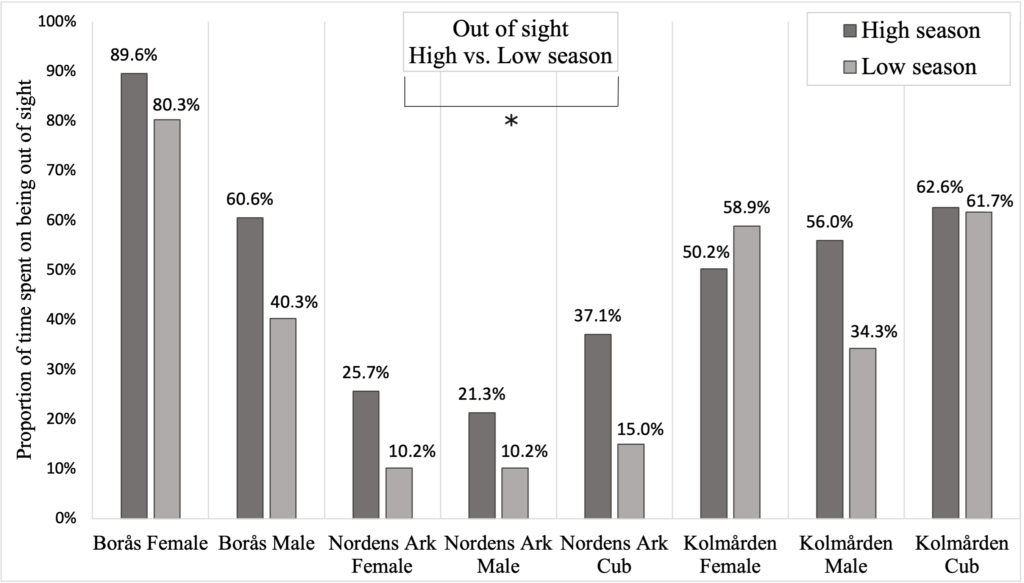
The Wilcoxon signed-rank test revealed that the lynx were out of sight significantly less during low season (p = 0.025) and instead resting significantly more (p = 0.017).
Social, active and stereotypic behavior was not significant (p>0.050) even though the last mentioned came close.
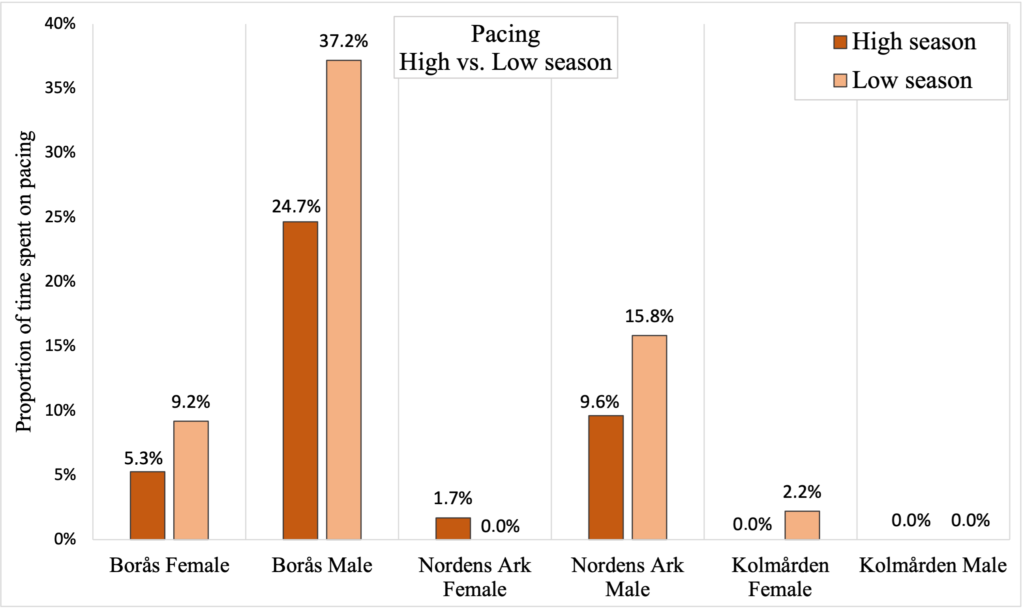
The red graph shows that there was a tendency for the lynx to pace more during the low season compared to the high season (p = 0.08).
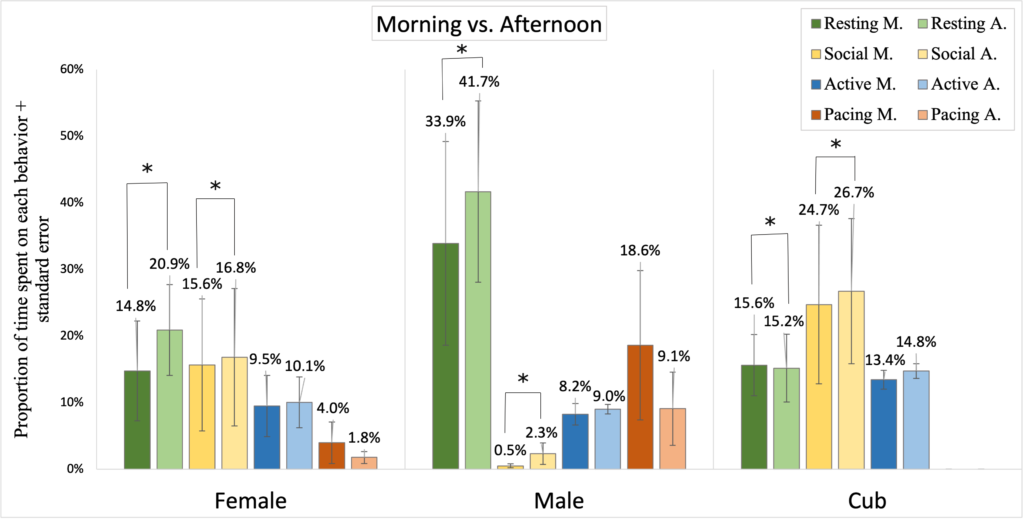
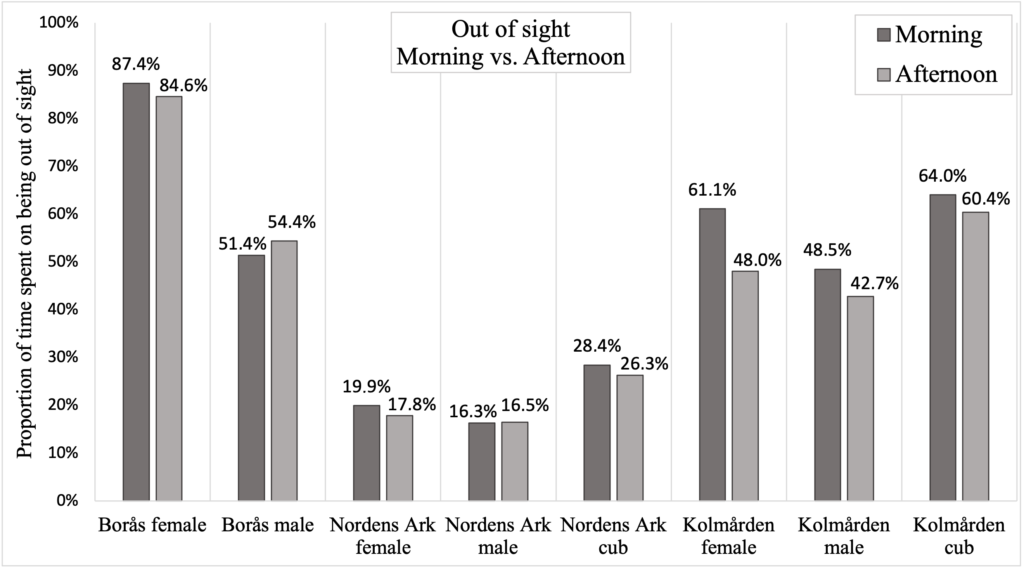
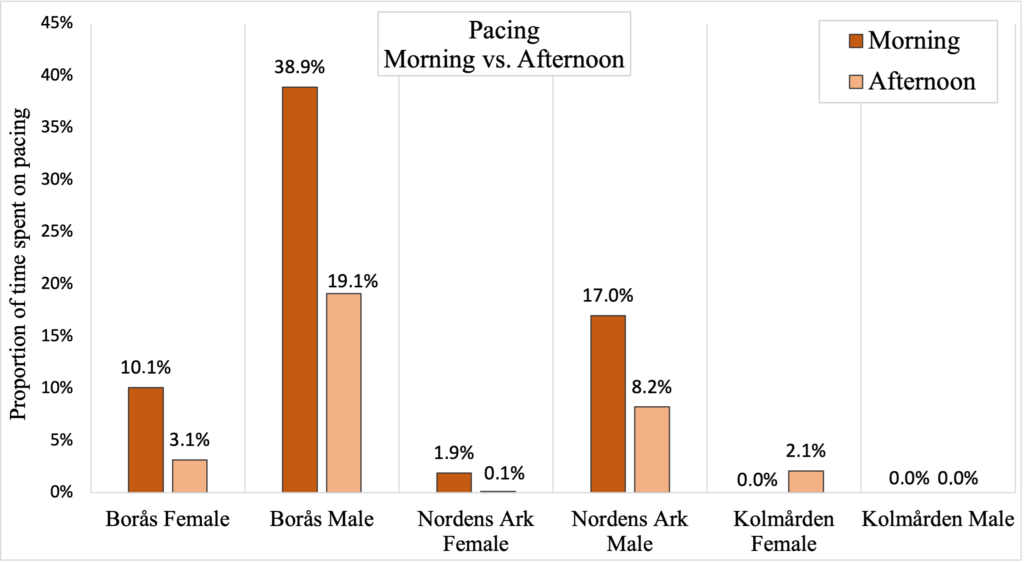
Morning vs. afternoon
These graphs are comparing mornings (09.00-12.30) to afternoons (12.30-18.00). Here, both high season and low season were combined.
The Wilcoxon signed-rank test revealed that the lynx rested significantly more in the afternoon than in the morning (p=0,025) and performed significantly more social behaviors in the afternoon compared to the morning (p=0,012).
Although it was not significant (p= 0.093) there is a trend among the lynx to be out of sight more in the morning.
Although it was not significant (p=0.138) there is a trend for lynx to pace more in the morning.
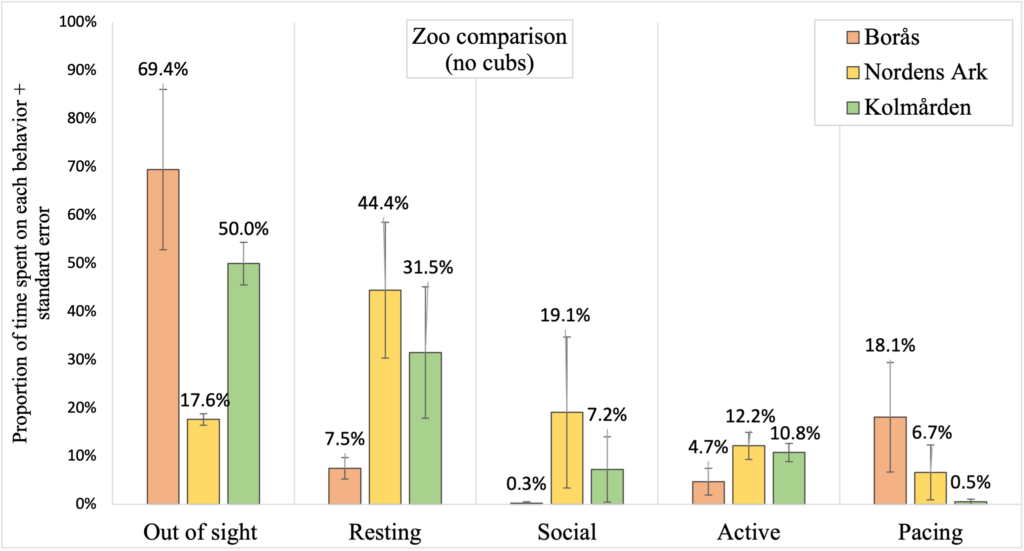
Zoo comparison
The graph on the right is comparing the three different zoos with each other. Only the adult lynx were included since Borås had no cubs. A Kruskal-Wallis test was used to compare the differences between the three zoos. The test found no significant differences between them (p>0.050).
Overall, the lynx who had cubs, Nordens Ark and Kolmården, were more social, more visible and paced less compared to the ones who had none, Borås.
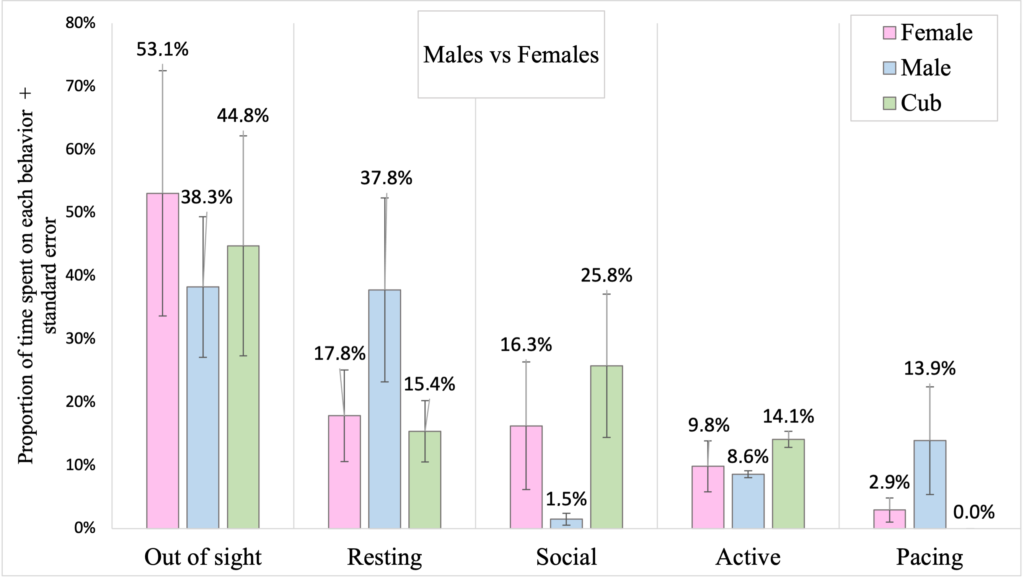
Males vs. females
The graph on the right is comparing male and female lynx.
When tested with a Kruskal-Wallis test there was no significant difference between them (p>0.050), The cubs are included in the graph for comparison but were not included in the statistical analysis.
Females were out of sight more as well as much more social than the males. That social behavior was almost exclusively directed towards their cubs. Cubs almost exclusively huddled with their mothers and groomed and played with their mothers more than twice as much compared to their fathers, 3.2% vs 0.72%. The males spent more time resting and pacing, compared to the females.
Other
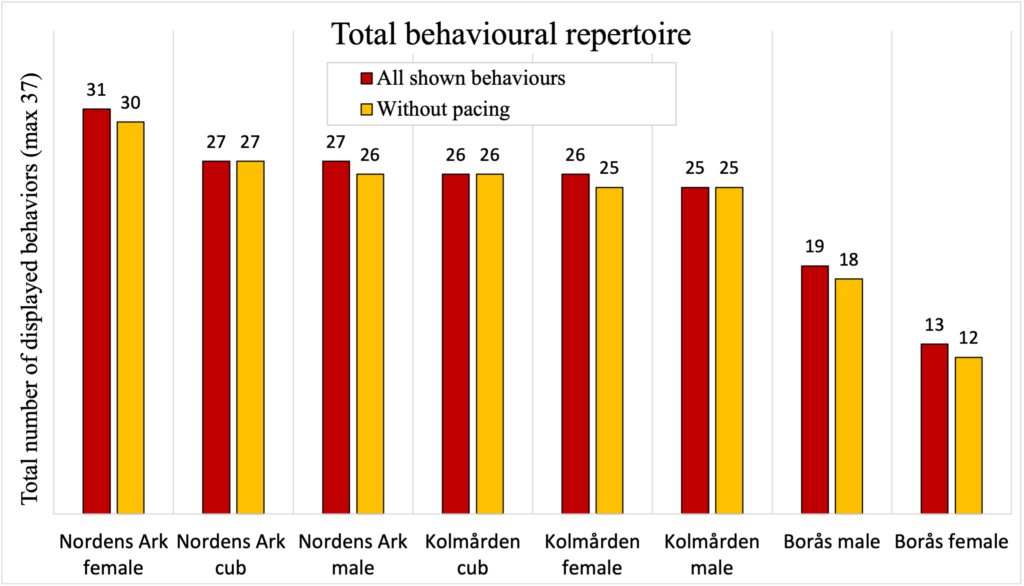
There were 37 different behaviors listed on the ethogram, meaning that is the maximum number that could be recorded. The graph on the right shows the number of actually displayed behaviors of each lynx. The lynx at Nordens Ark displayed the greatest range of behaviors, followed closely by those at Kolmården. The lynx at Borås showed a small range of behaviors, especially compared to those at Nordens Ark. Again, these were the lynx who had no cubs.
If you have made it this far and want to know what all of this means- Follow the button to the Discussion!