Diet composition
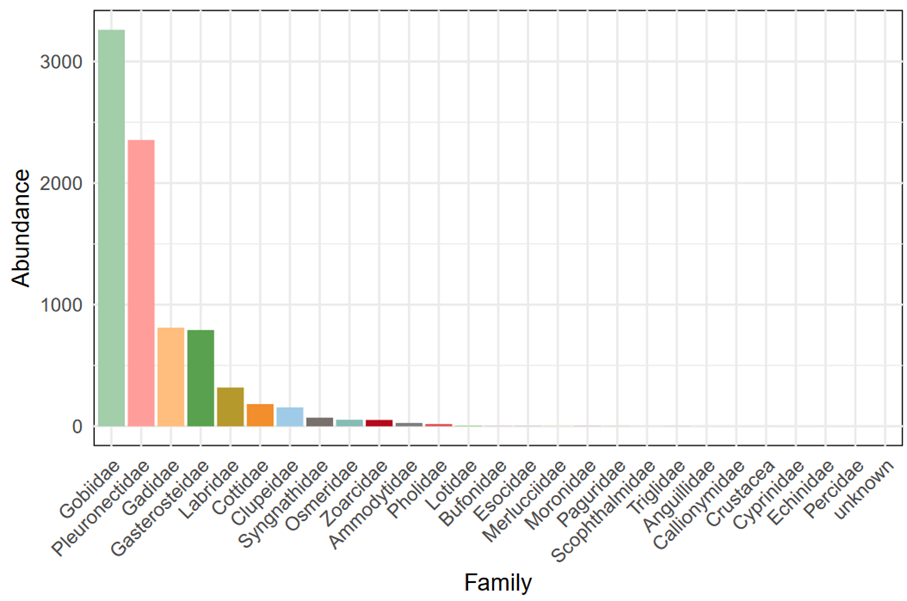
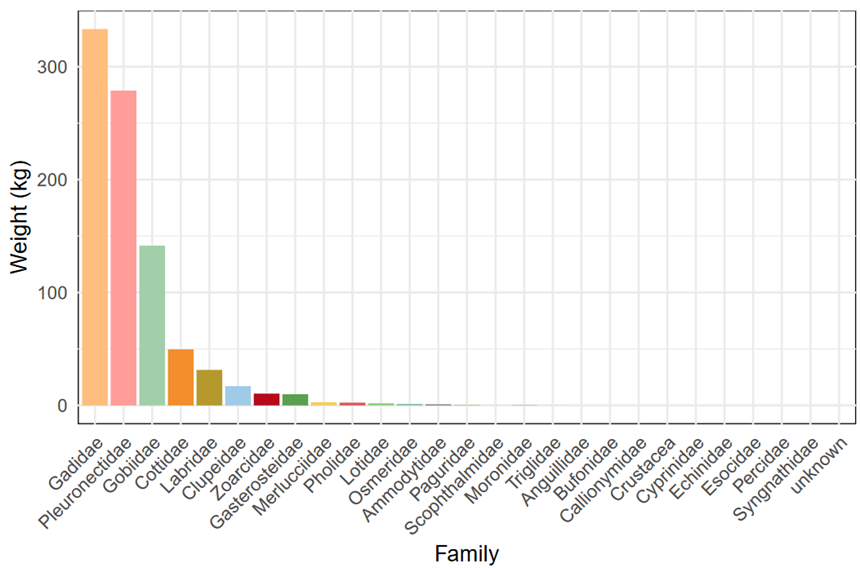
A total of 220 stomach samples and 32 pellet samples were analysed. Using prey remains found in the samples, we estimated that a minimum of 8 827 individuals had been consumed across all samples. A total of 26 families were identified. Overall, goby (Gobiidae) was the family with the highest relative abundance across all diet samples, followed by flatfish (Pleuronectidae) and codfish (Gadidae). In terms of biomass, Gadidae made up the highest proportion of the diet composition, followed by Pleuronectidae and Gobiidae.
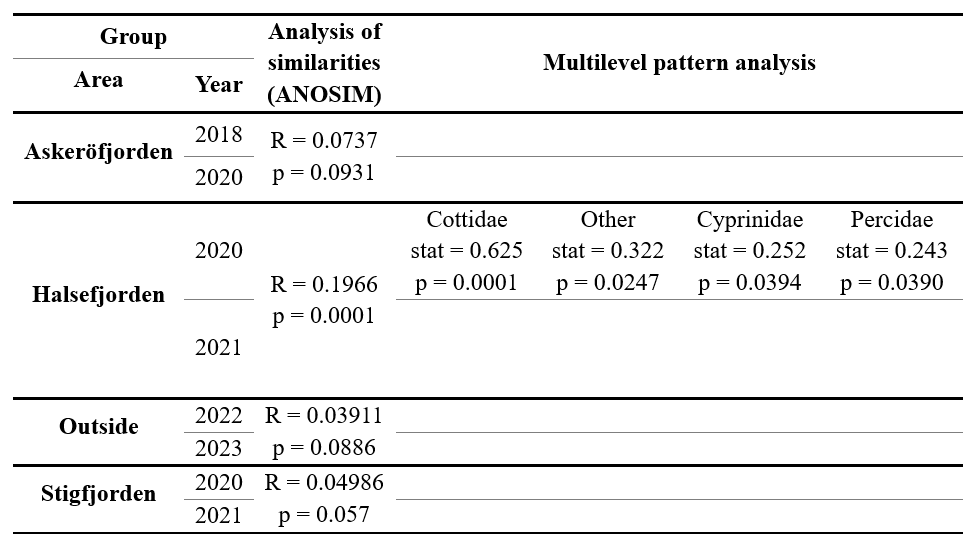
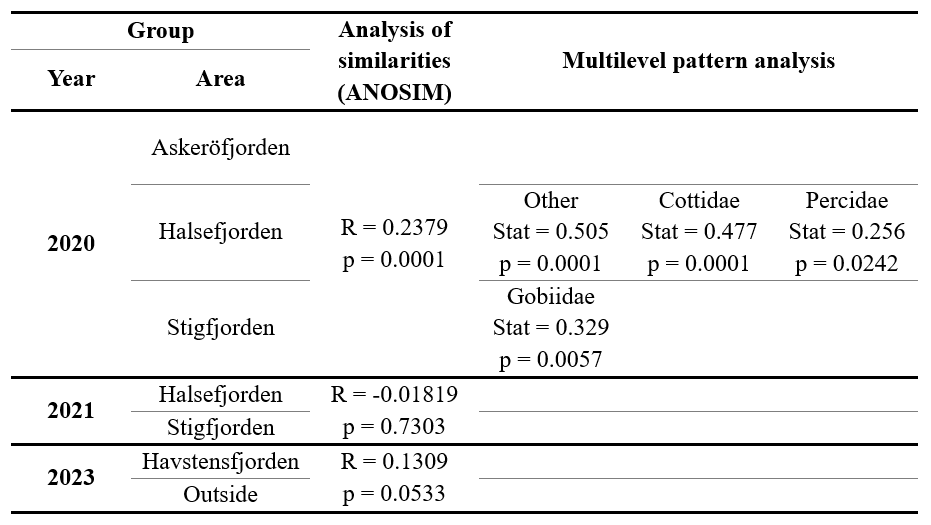
To assess how year affected prey family biomass within fjords, four ANOSIMs were performed, comparing each fjord over two years. Only the ANOSIM performed to compare Halsefjorden between 2020 and 2021 showed a significant but slight difference in family biomass, with four families, Cottidae, Other, Cyprinidae, and Percidae, strongly associated with the year 2020.
The non-metric multidimensional scaling (nMDS) plot allows us to visualise the overlap of family biomass within samples across the different fjords, with some differences between the areas.
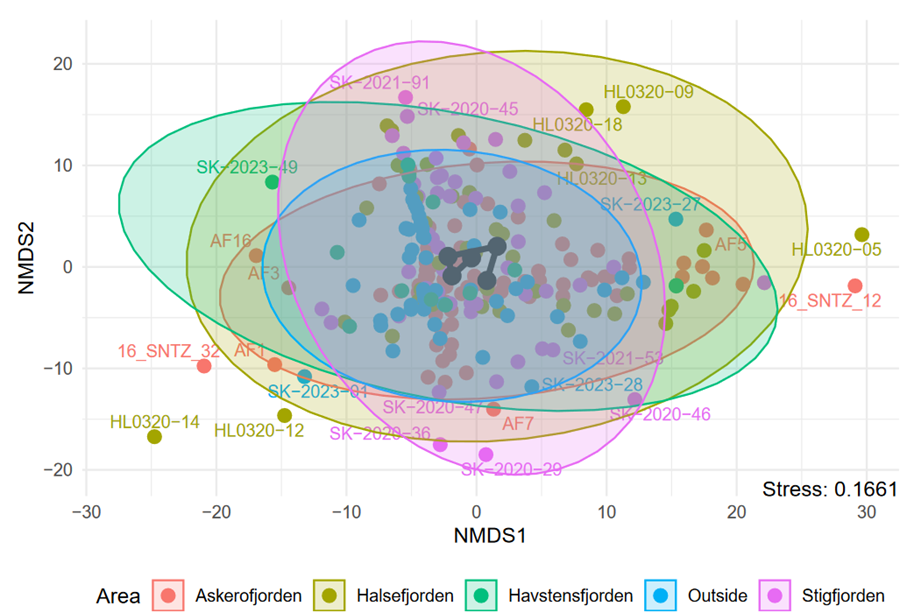
To assess how area affected prey family biomass, three ANOSIMs were performed on samples collected during 2020, 2021 and 2023. Only the ANOSIM performed to compare Askeröfjorden, Halsefjorden and Stigfjorden in 2020 showed a significant but slight difference between prey biomass in these areas. The “Other” group, Cottidae and Percidae were all strongly associated with Halsefjorden, while Gobiidae was strongly associated with Stigfjorden. No strong association was found for Askeröfjorden.
Comparing pellet and stomach samples
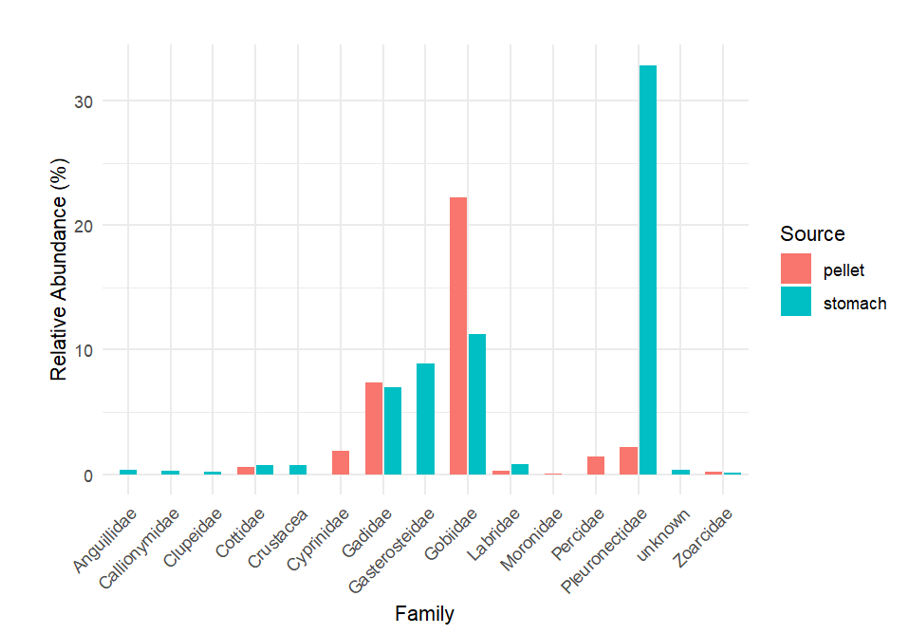
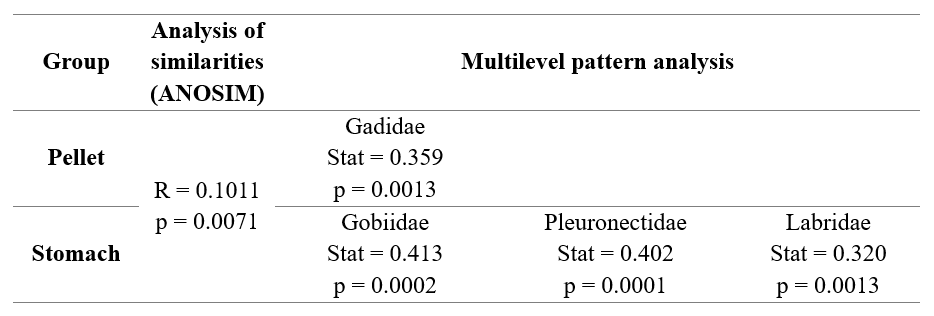
The analysis of similarities run to assess differences in prey biomass by sample source at Askeröfjorden in 2020 found slight yet significant differences in prey families in stomach samples compared to pellet samples. A multilevel pattern analysis found that the Gadidae family was more strongly associated with pellet samples, while three families, Gobiidae, Pleuronectidae, and Labridae, had a stronger association with stomach samples.
Comparing diet and available trawl data
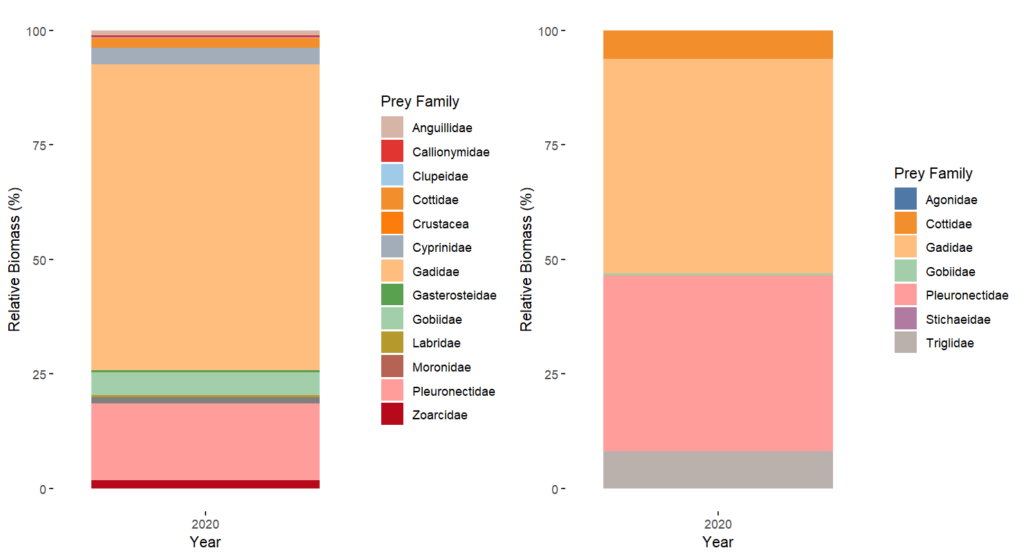
Diet composition
In Askeröfjorden in 2020, Gadidae made up the largest proportion of both diet and trawl biomass, accounting for 66.7% and 46.8% respectively. Pleuronectidae was the second most important family, contributing 16.7% in the diet samples and 38.3% in the trawl samples. Gobiidae was the third family in terms of biomass within diet samples (5%) while Triglidae was the third family in terms of biomass within trawl samples (8.1%).
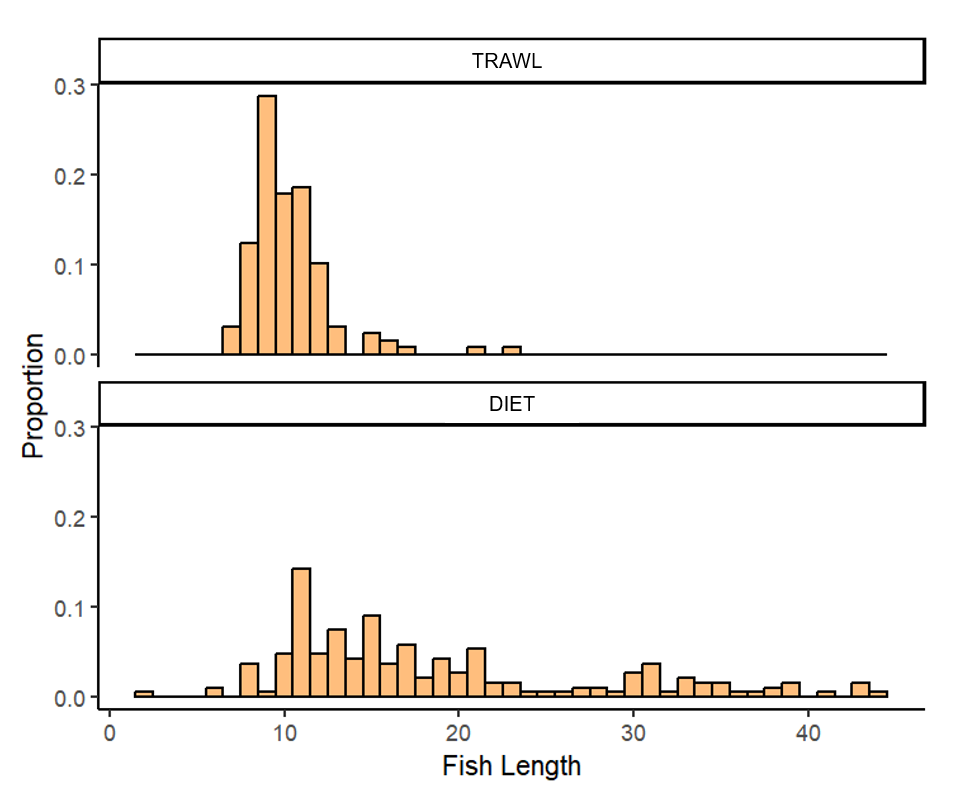
Length frequency distributions
In Askeröfjorden in 2020, the trawl survey data seemed to show a distribution centred around fish 10 cm in length. In comparison, there was no obvious pattern in stomach data, although the largest proportion of fish were between 10 and 20 cm. Gadidae caught during the trawl monitoring survey were generally shorter than those eaten by cormorants, with no individuals larger than 25 cm found, while cormorants caught individuals up to 45 cm in length.