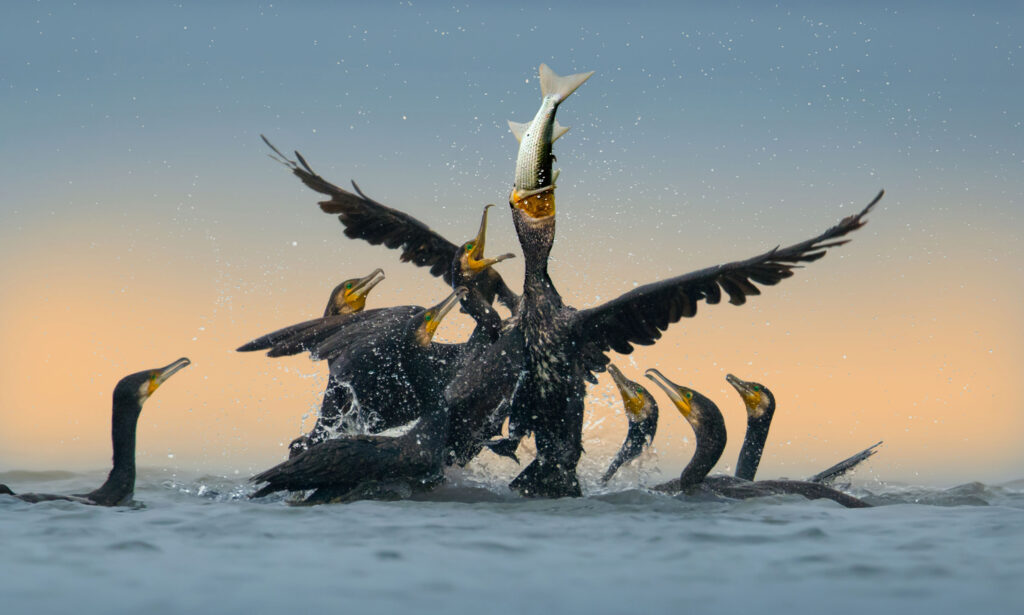
Stomach samples were procured from local hunters operating in the 8-fjords area, more specifically from four fjords within the area (Askeröfjorden, Halsefjorden, Stigfjorden and Havstensfjorden) and two islands outside the area (which were labelled “Outside”).
The stomachs were dissected with whole or partially digested fish removed to be identified and measured. All organic material was washed away to retain only the hard elements. After drying these were sorted and all important skeletal elements such as otoliths, spines, and vertebrae were removed and identified.
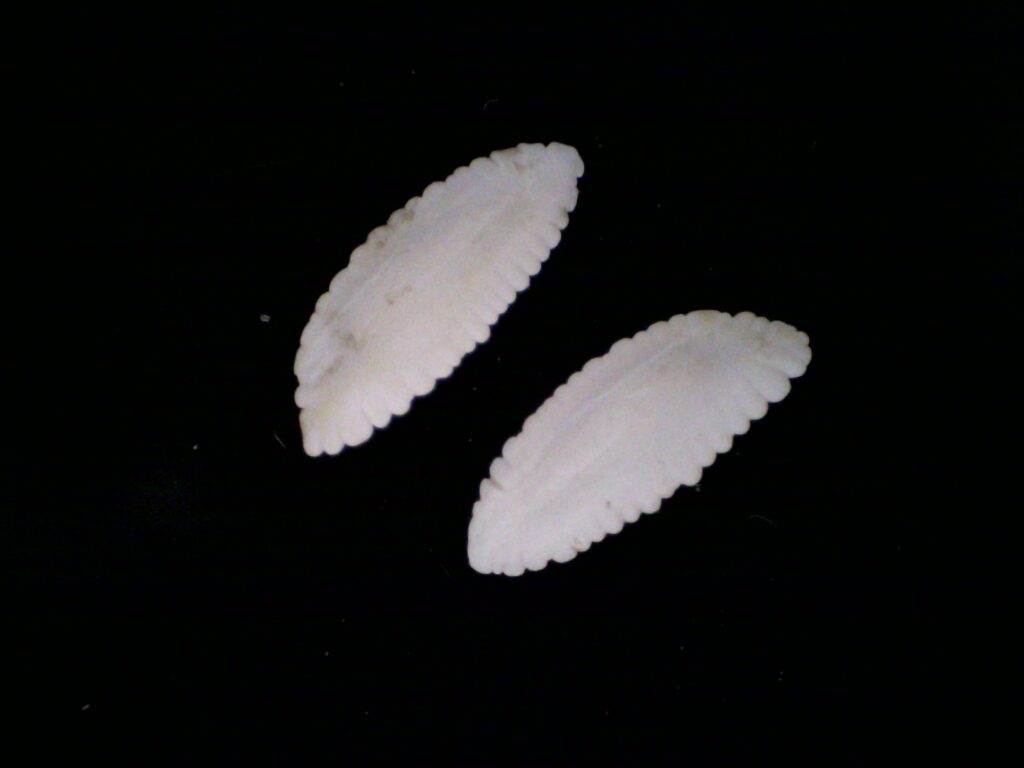
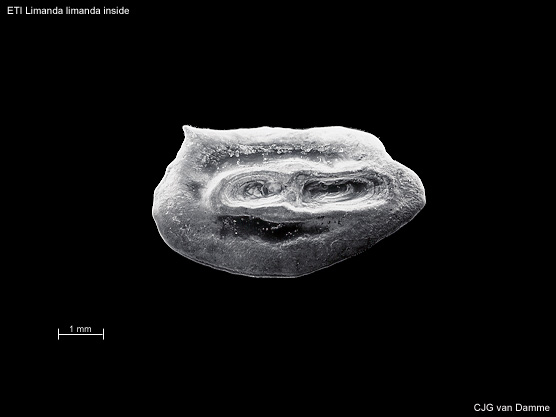
Fish sagittal otoliths (ear bones) are species specific with important structures and features which allow identification [1, 2]. Despite this, otoliths from species within the same family may have very similar features, preventing accurate identification to species level. For this reason the study was conducted at prey family level.
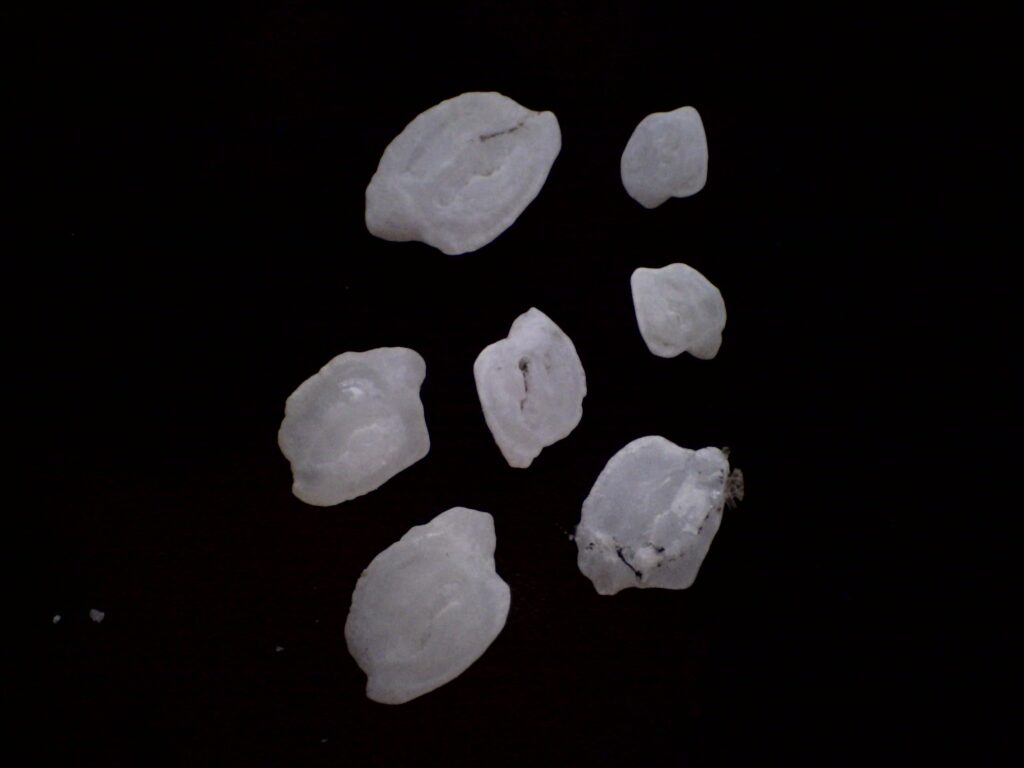
Otoliths were graded by level of erosion into three different wear classes to facilitate size correction and thus enable us to more accurately estimate fish length and weight. The three wear classes are based on morphological factors such as shape, lobation, thickness, and sulcus definition [2, 3].
Otolith length and width was measured from photos taken using a Dino-Lite digital microscope and the DinoCapture 2.0 software [4] and which were then input into ImageJ [5]. The total number of fish in each stomach was estimated by dividing the total number of otoliths found for each species and/or family by two. In the samples where the divided sum was a decimal the total number of fish was rounded to the next highest integer.
To account for otolith erosion due to the acidic conditions encountered within the digestive system, we calculated correction factors to estimate original otolith size, and thus avoid under- or overestimating fish length and weight.
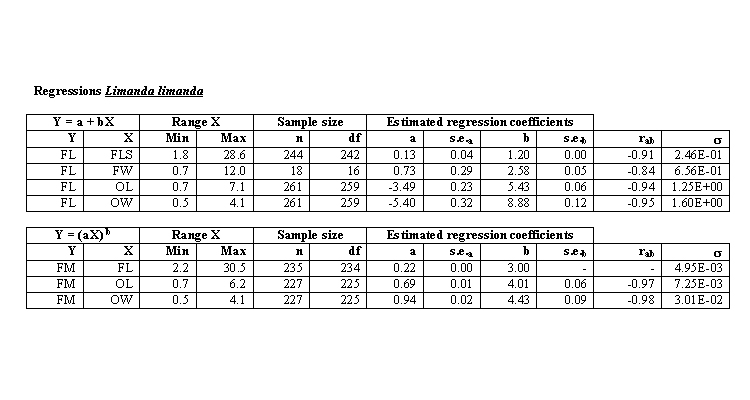
Estimated fish length and weight were calculated using species specific regressions by Leopold et al (2001) or Härkönen (1986), using corrected otolith length or width.
These were compared to otoliths from pellets analysed during a previous study [6] and with data from trawl surveys taken during 2018 and 2020 in Askeröfjorden and during 2023 in Havstensfjorden.
To visualise diet differences between the fjords, non-metric multidimensional scaling (nMDS) was implemented using a Bray-Curtis dissimilarity matrix [6].
Pairwise analyses of similarity (ANOSIM) were conducted on square root transformed data to assess the significance of the differences in diet composition between the different fjords over several years using the vegan package [7] in R version 4.2.3 [8]. Following this, a multi-level pattern analysis, using the indicspecies package in R [9], was applied to the data from any significant ANOSIM tests to find the grouping (Year-Area) with the highest association to selected prey families.
References
- Härkönen, T. (1986). Guide to the Otoliths of the Bony Fishes of the Northeast Atlantic. Danbiu ApS, Hellerup, Denmark.
- Leopold, M.F., van Damme, C.J.G., Philippart, C.J.M. & Winter, C.J.N. (2001). Otoliths of North Sea Fish. https://otoliths-northsea.linnaeus.naturalis.nl/linnaeus_ng/app/views/introduction/topic.php?id=3327&epi=87
- Tollit, D.J., Steward, M.J., Thompson, P.M., Pierce, G.J., Santos, M.B. & Hughes, S. (1997). Species and size differences in the digestion of otoliths and beaks: implications for estimates of pinniped diet composition. Canadian Journal of Fisheries and Aquatic Sciences, 54(1): 105-119.
- AnMo Electronics Corporation. (2016). DinoCapture 2.0 (version 1.5.49) [Software] https://www.dino-lite.com/
- Schneider, C. A., Rasband, W. S., & Eliceiri, K. W. (2012). NIH Image to ImageJ: 25 years of image analysis. Nature Methods, 9(7), 671–675. doi:10.1038/nmeth.2089
- Bray, J. R., & Curtis, J. T. (1957). An Ordination of the Upland Forest Communities of Southern Wisconsin. Ecological Monographs, 27(4), 325–349. https://doi.org/10.2307/1942268
- Oksanen, J., Simpson, G., Blanchet, F., Kindt, R., Legendre, P., Minchin, P., O’Hara, R., Solymos, P., Stevens, M., Szoecs, E., Wagner, H., Barbour, M., Bedward, M., Bolker, B., Borcard, D., Carvalho, G., Chirico, M., De Caceres, M., Durand, S., Evangelista, H., FitzJohn, R., Friendly, M., Furneaux, B, Hannigan, G, Hill, M, Lahti, L., McGlinn, D., Ouellette, M., Ribeiro Cunha, E., Smith T., Stier A., Ter Braak, C., & Weedon, J. (2022). _vegan: Community Ecology Package_. R package version 2.6-4, https://CRAN.R-project.org/package=vegan
- R Core Team. (2023). R: A language and environment for statistical computing. R Foundation for Statistical Computing, Vienna, Austria. https://www.R-project.org/
- De Cáceres, M., & Legendre, P. (2009). Associations between species and groups of sites: indices and statistical inference. Ecology, 90, 3566-3574. doi:10.1890/08-1823.1 https://doi.org/10.1890/08-1823.1