Roe deer
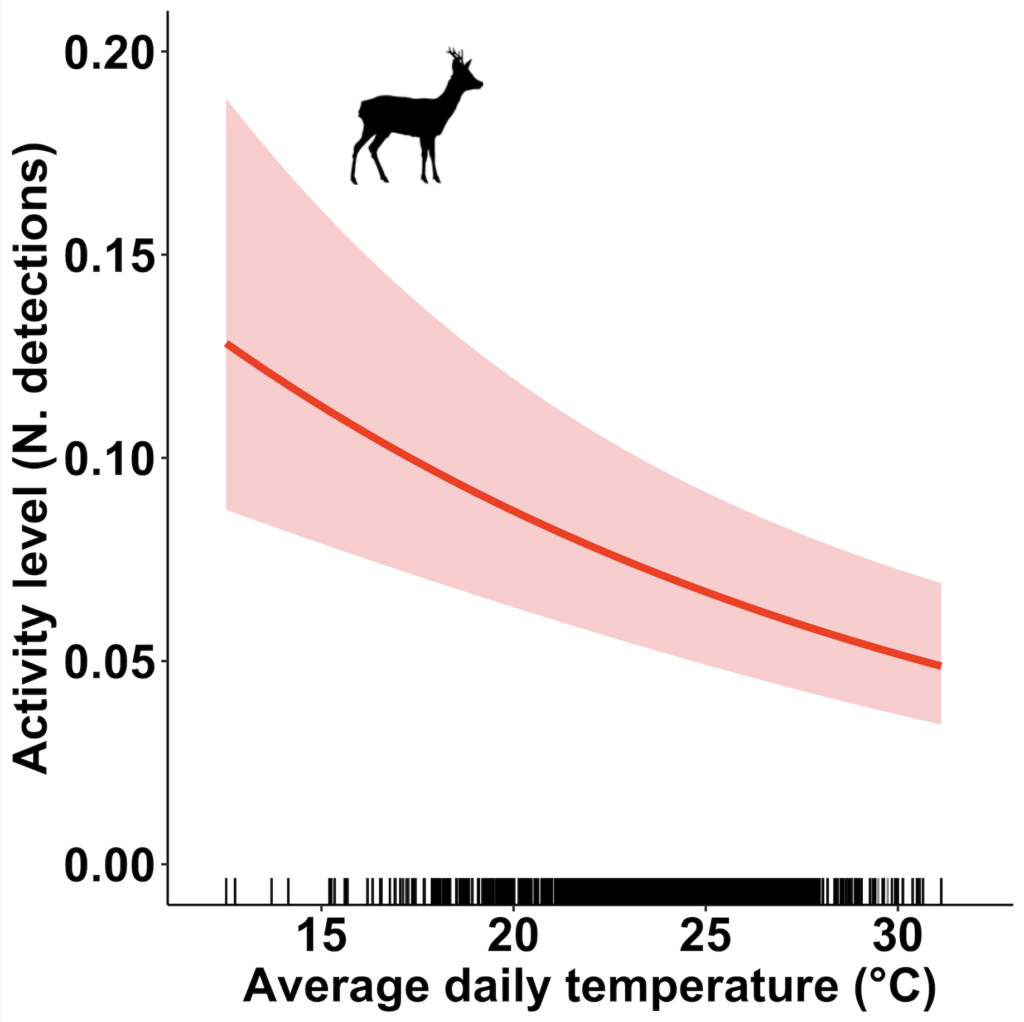
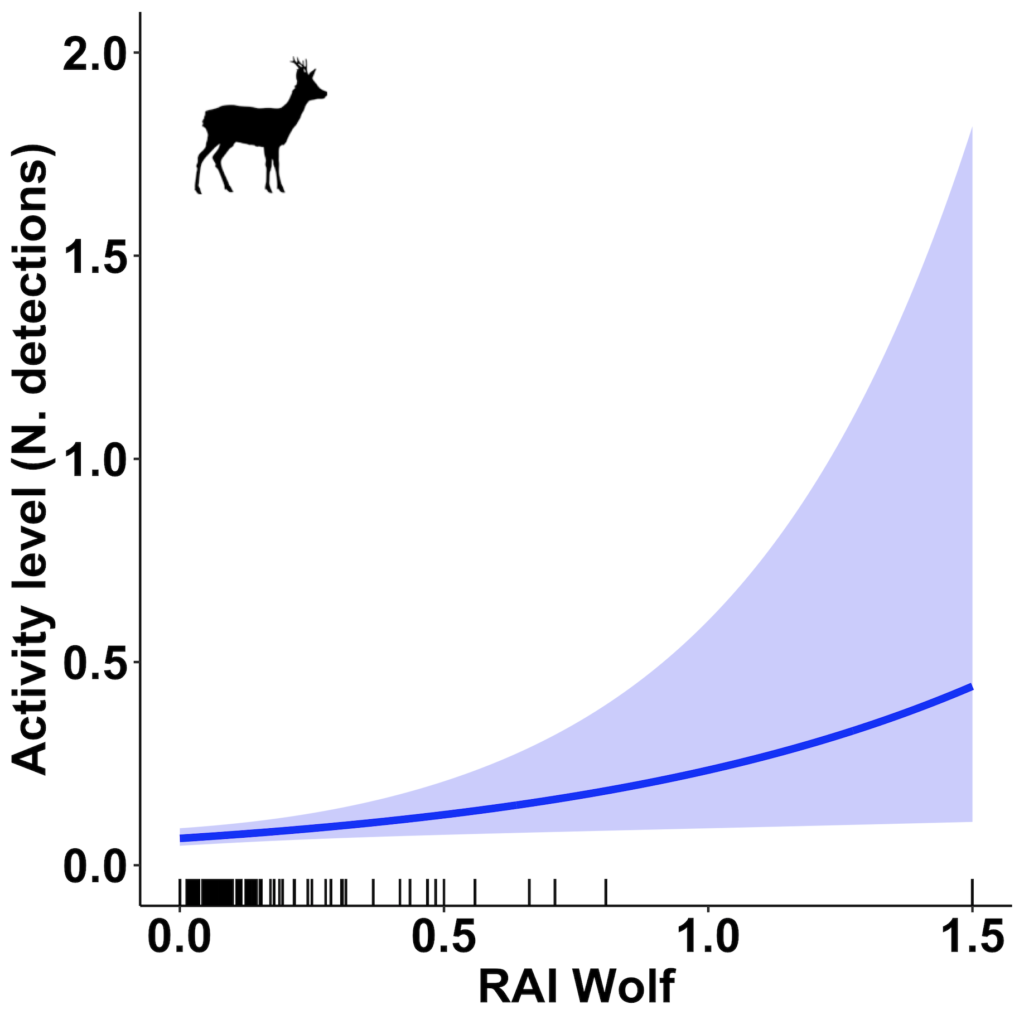
Roe deer showed a decrease of diel activity level with the increase of the average daily temperature (red graph on the left) and a positive association between their detection rate and the one of wolves (blue graph on the right).
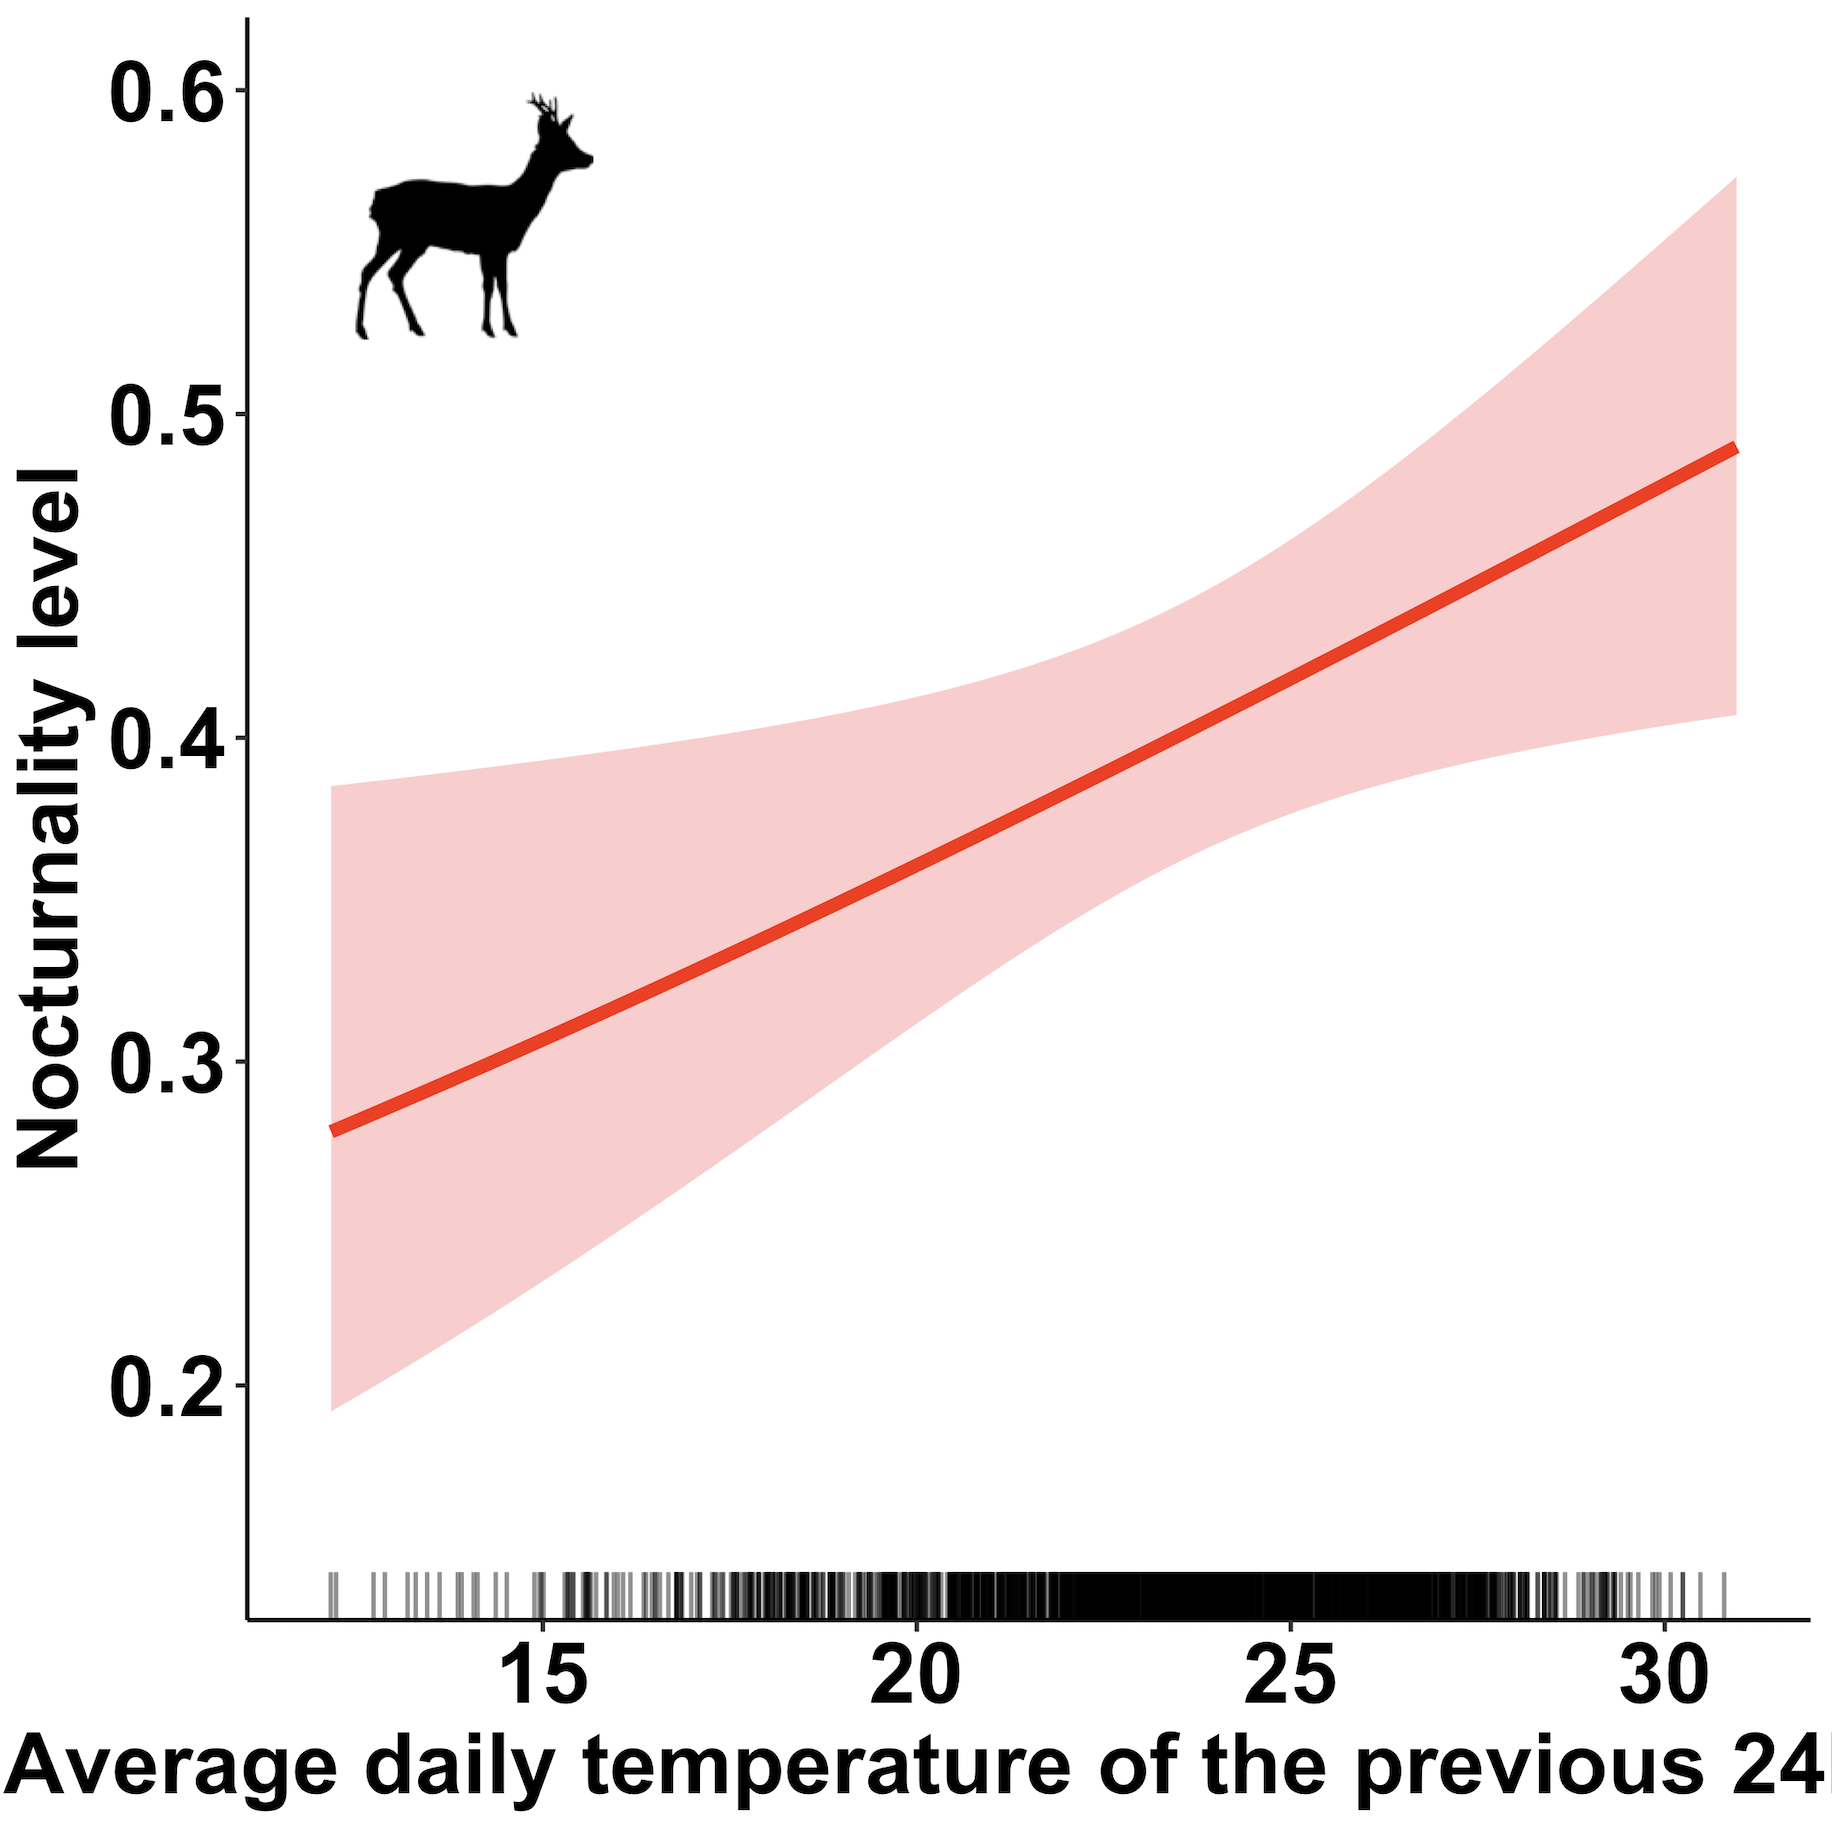
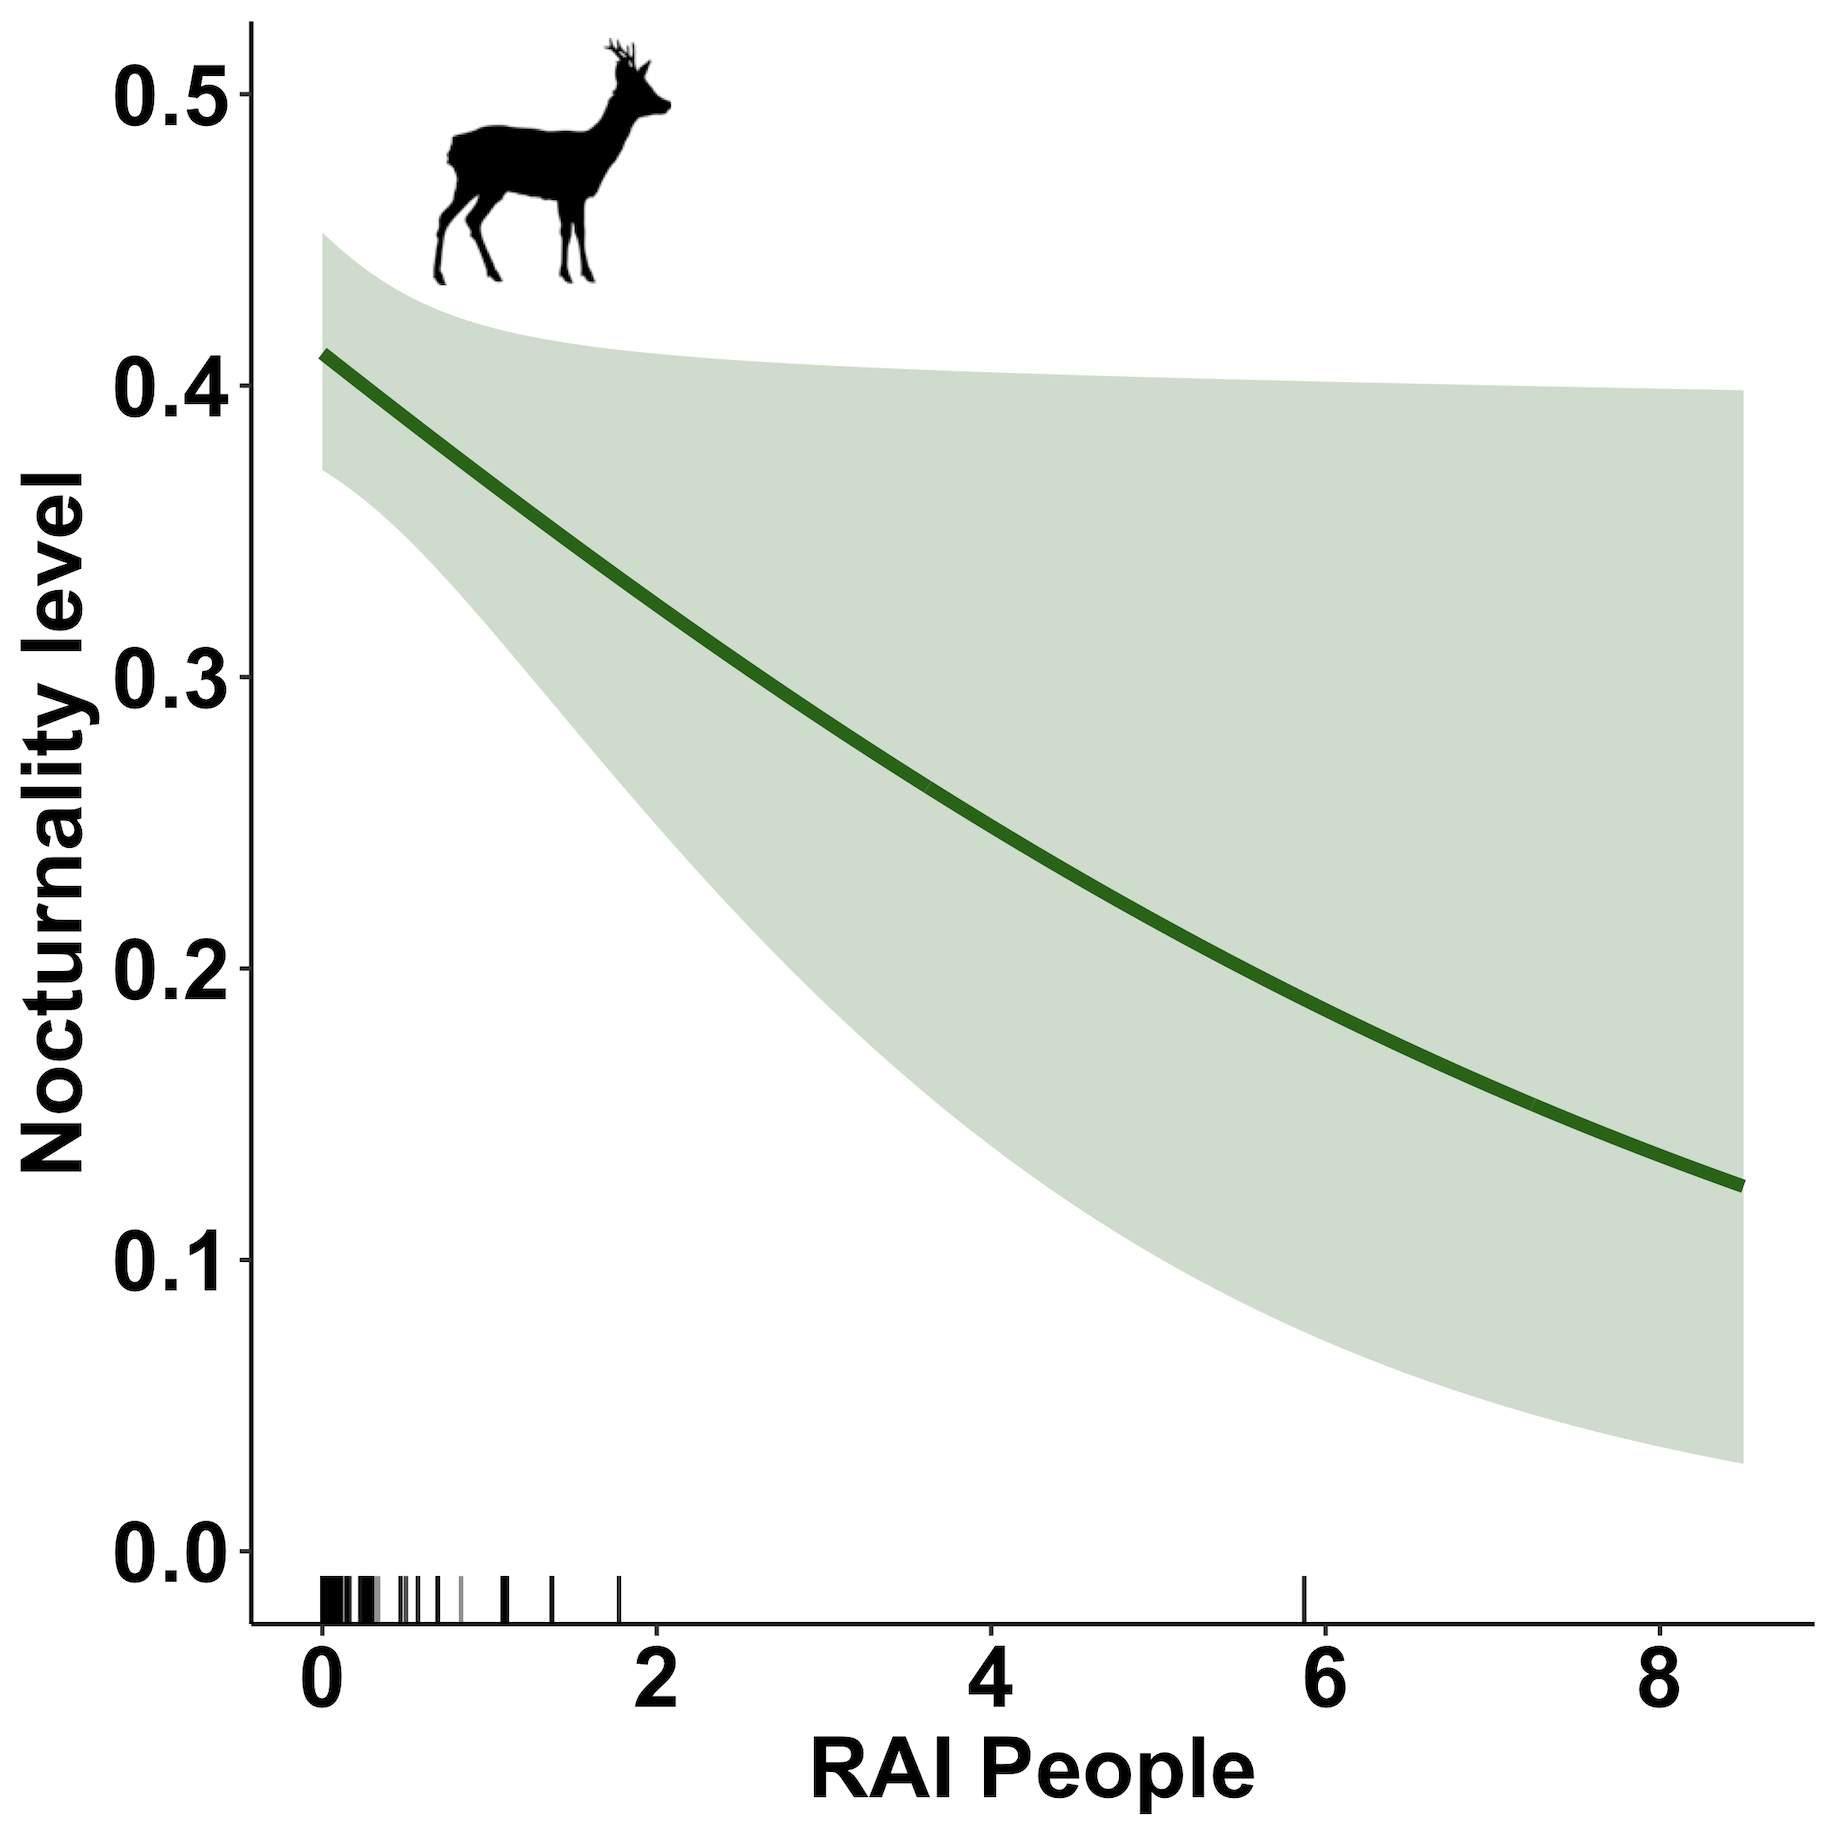
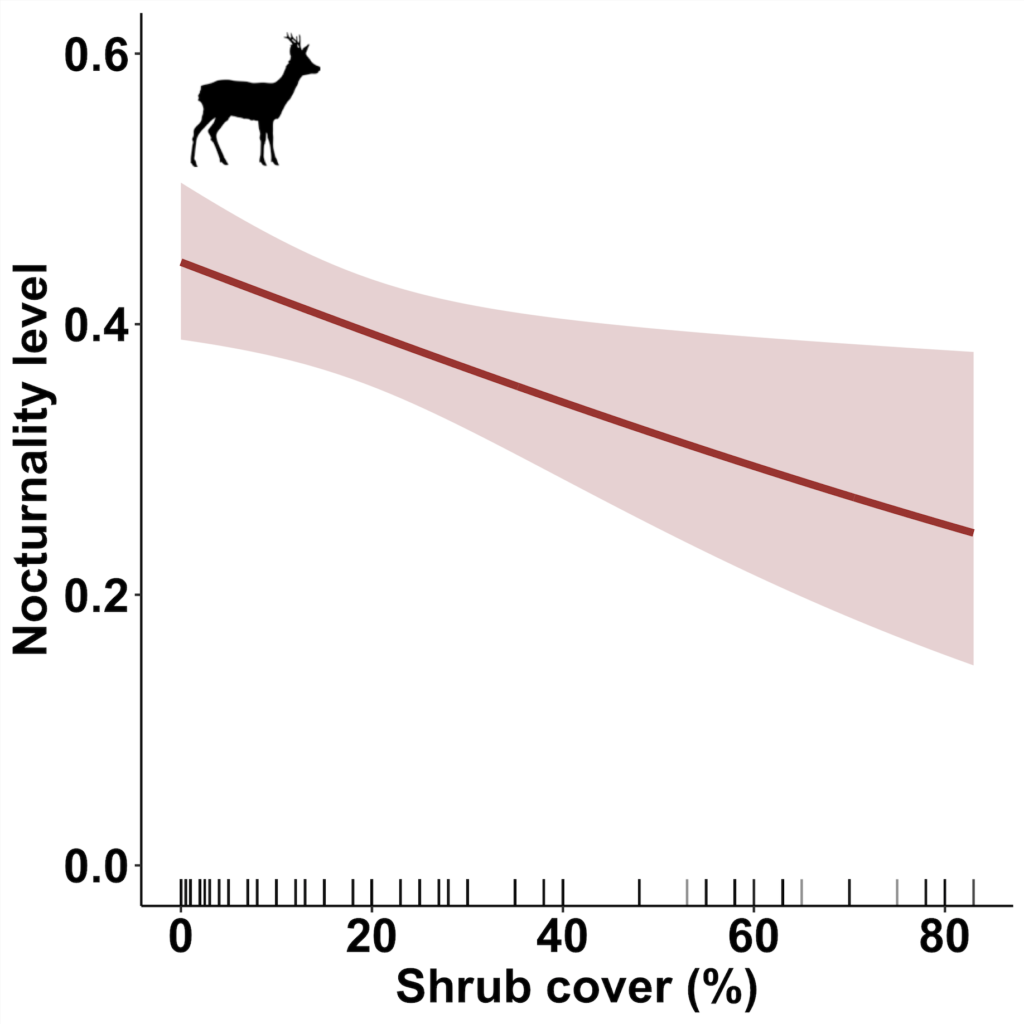
Regarding the analysis of nocturnal activity, this species increased their activity during the night hours with the increase of the average temperature experienced in the previous 24 hours (red graph on the left). In addition, roe deer reduced their nocturnality with the increase of human passage rate in the areas (green graph in the middle) and with the increase of shrub cover (brown graph on the right), which was inserted in the model as a control variable.
Fallow deer
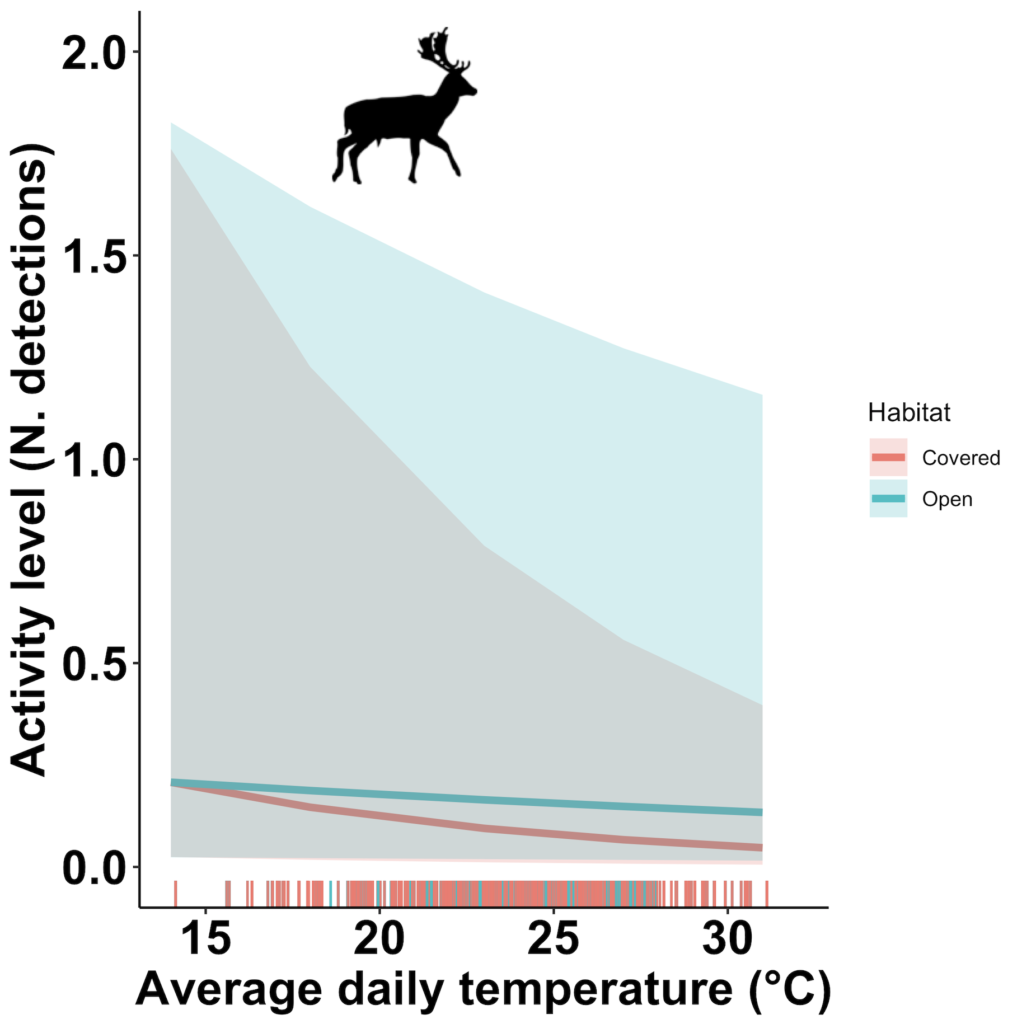
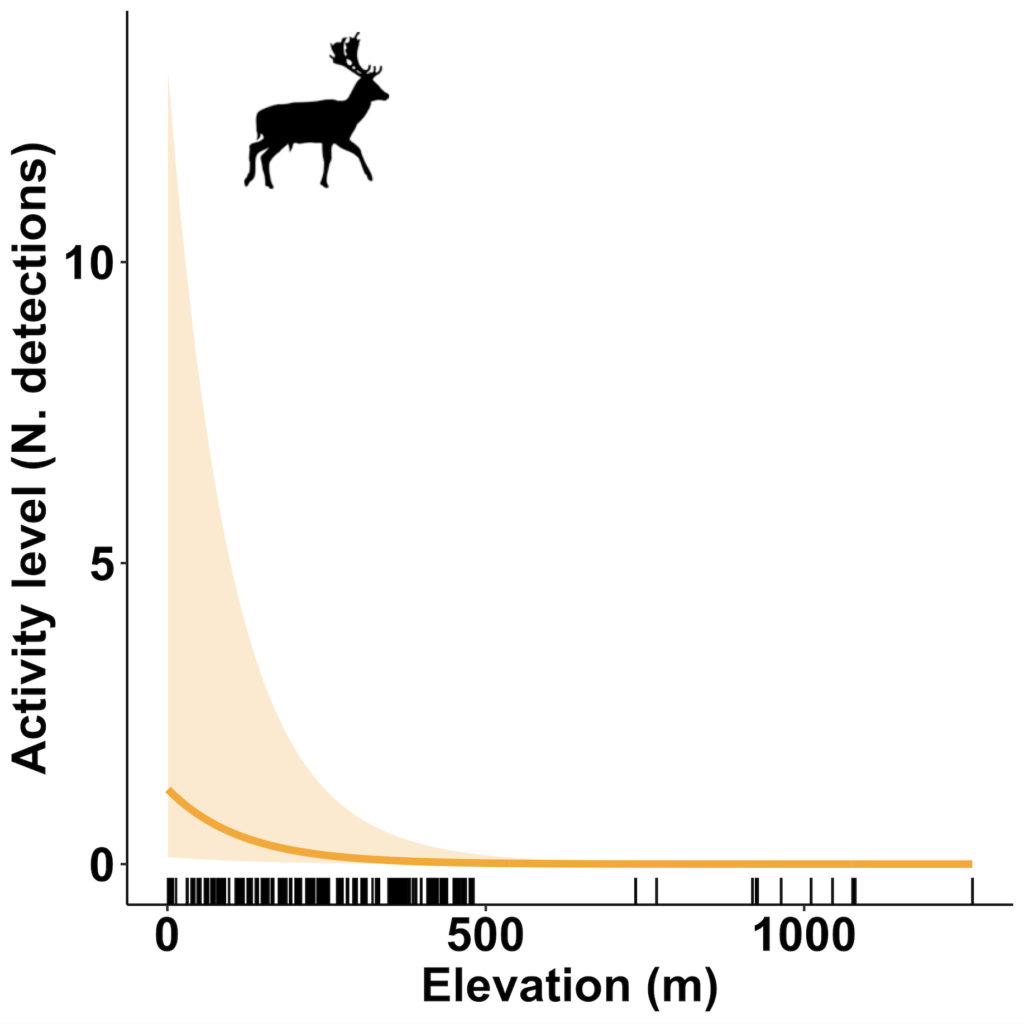
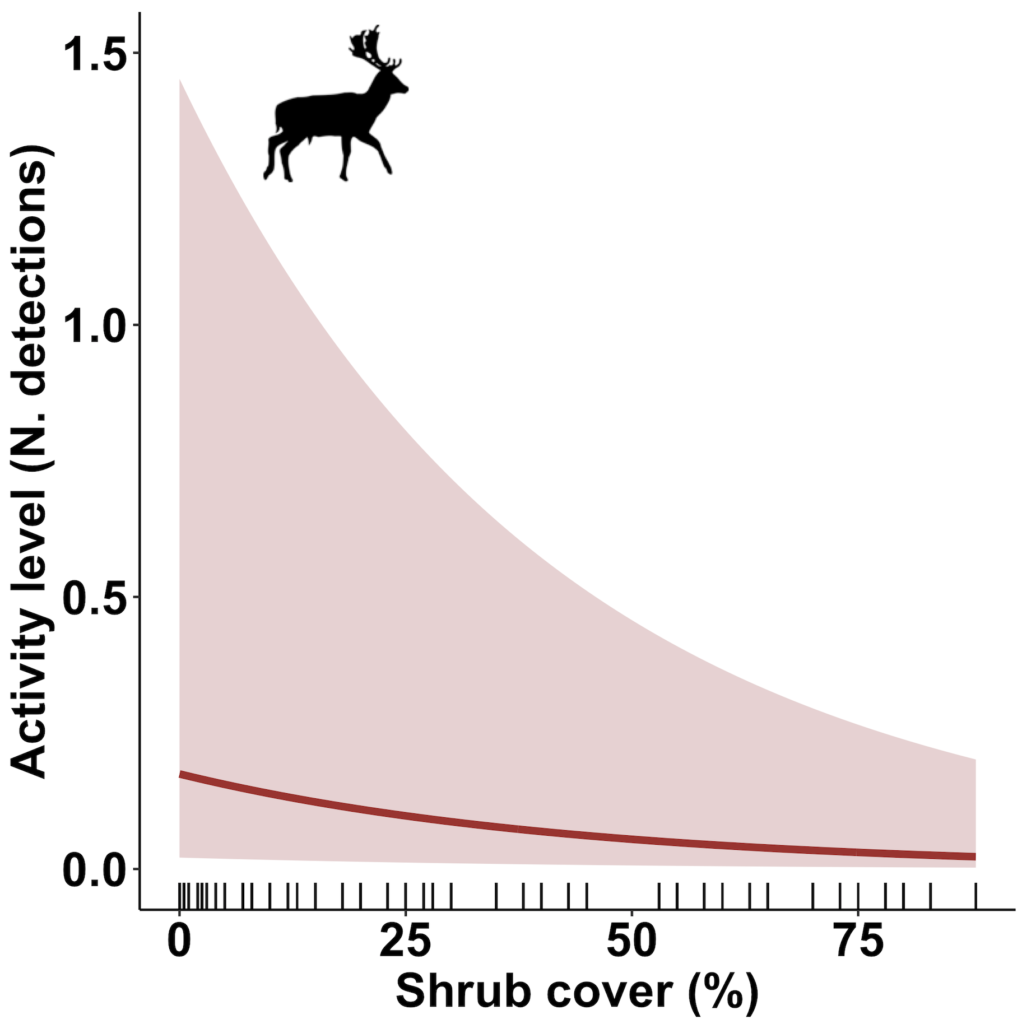
Fallow deer showed a decrease in diel activity level with increasing temperatures, with this decrease in activity being stronger in closed habitat types (red, left graph) compared to open habitat types (light blue, left graph). Moreover, they decreased their diel activity level with the increase of elevation (yellow graph in the middle) and shrub cover (brown graph on the right).
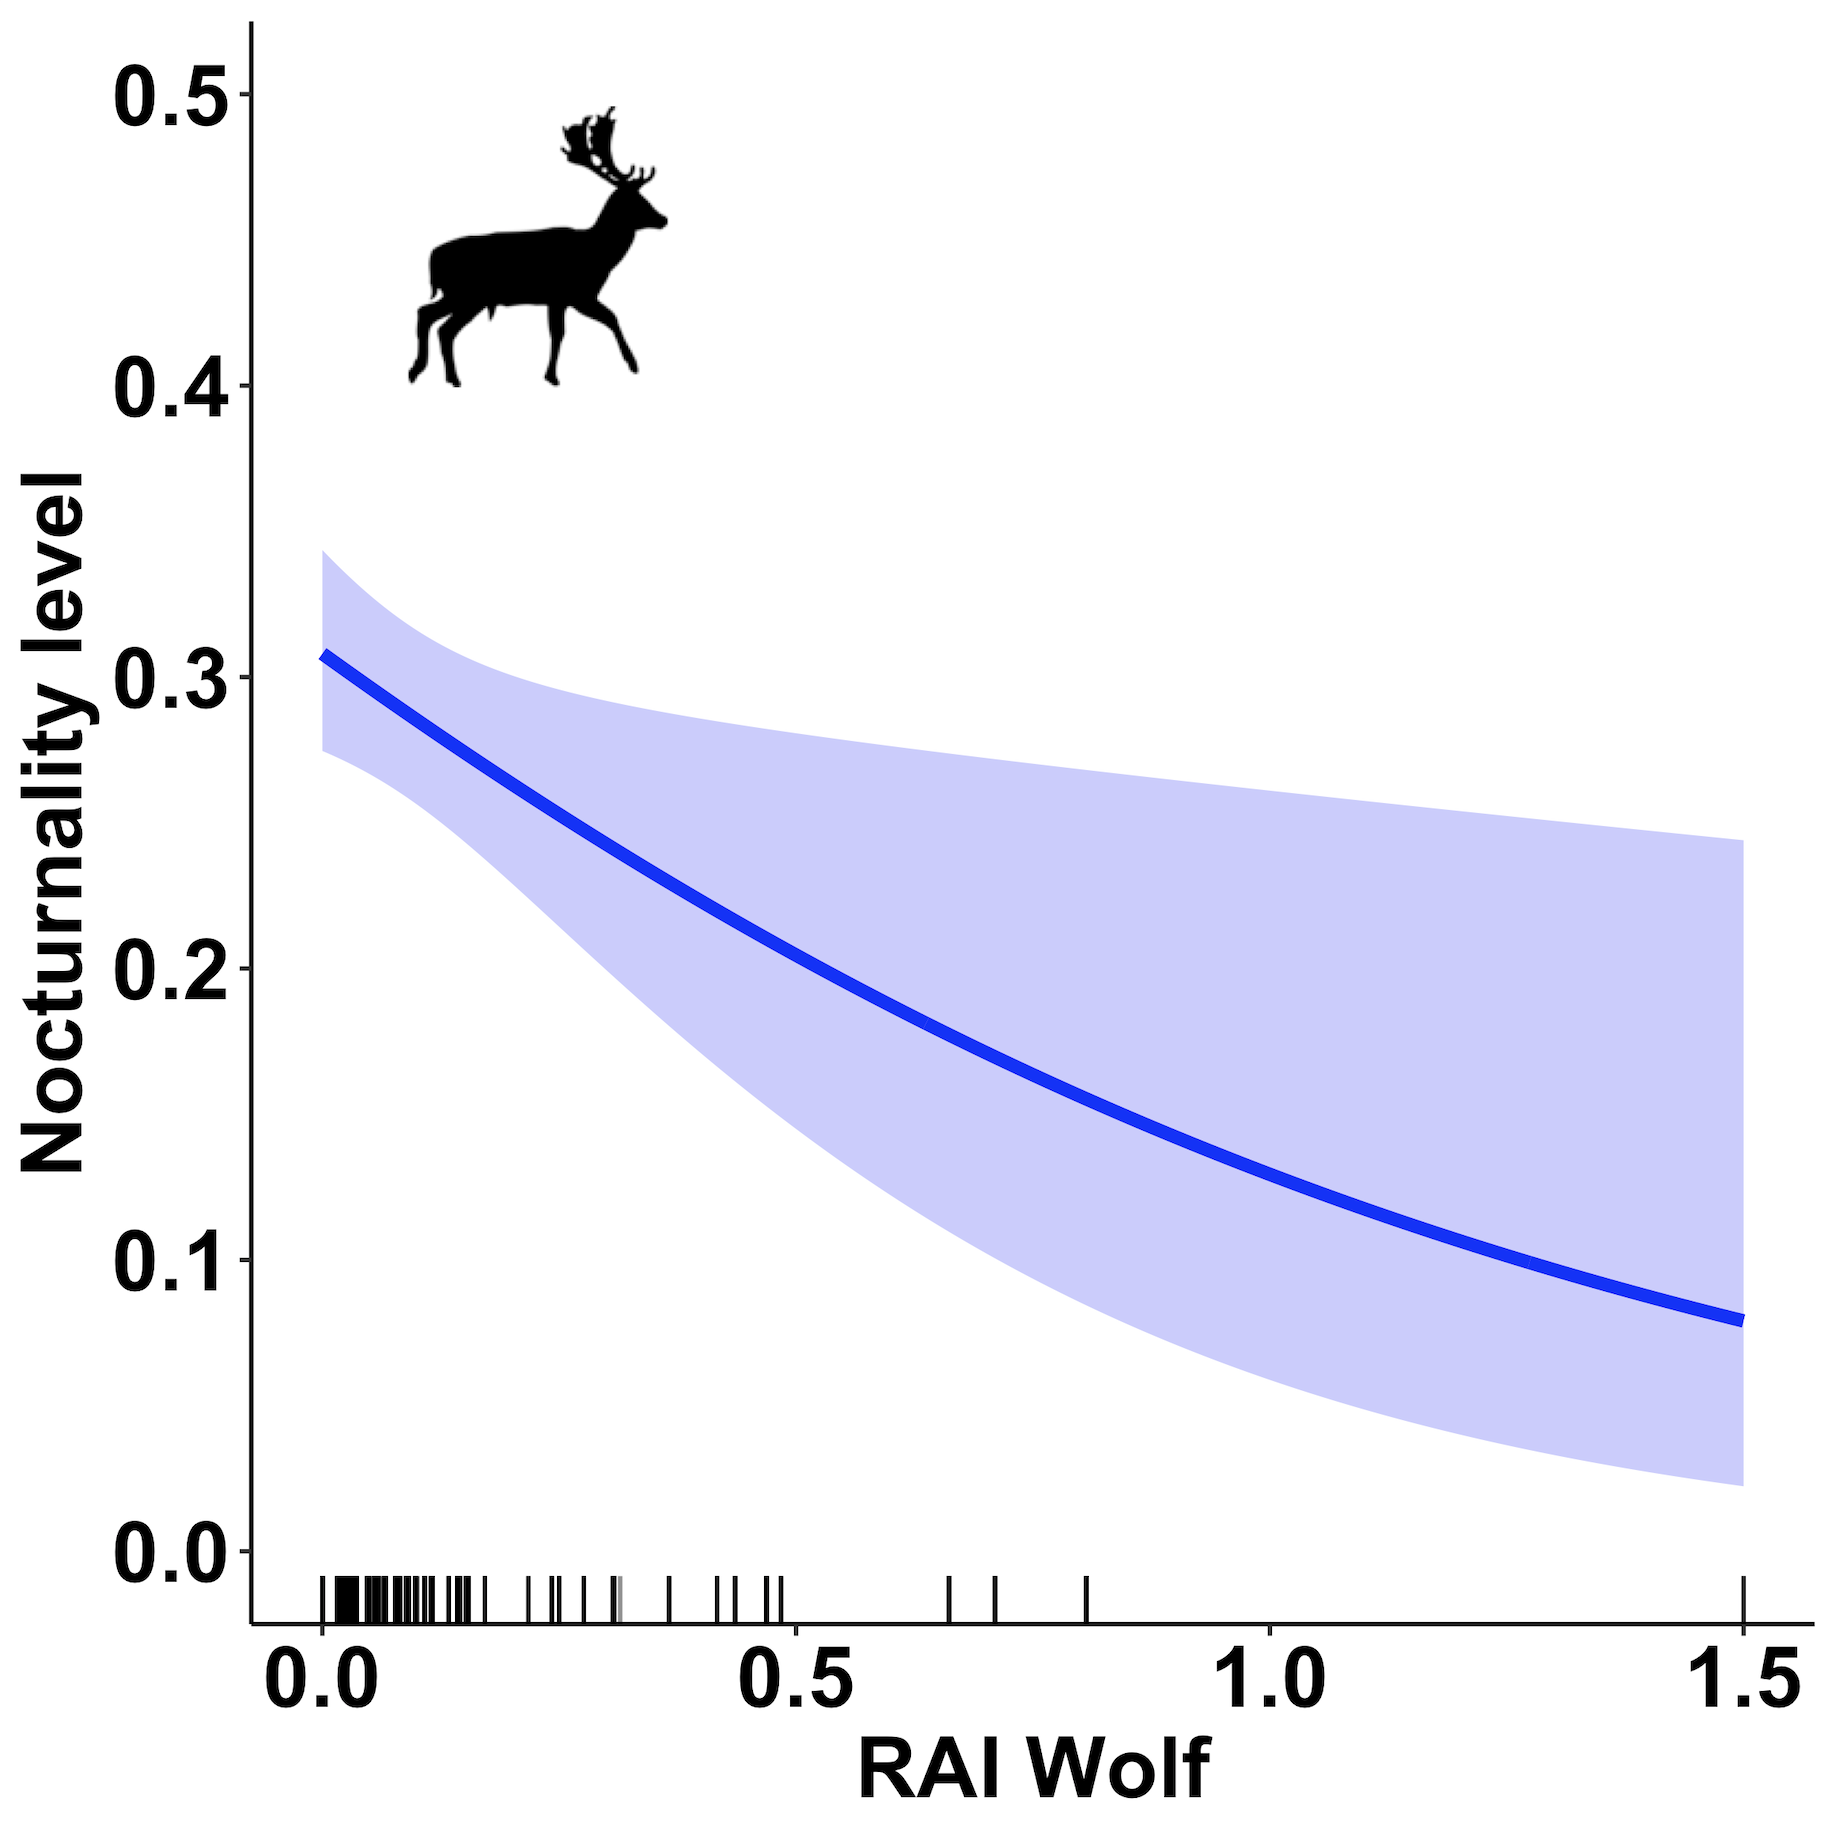
For this species, the outcome of the nocturnal analysis showed a decrement in their nocturnal activity with an increment of wolf detection rate (blue graph). Additionally, a second result from this analysis showed that fallow deer had a greater probability of being nocturnal in open habitats.
Wild boar
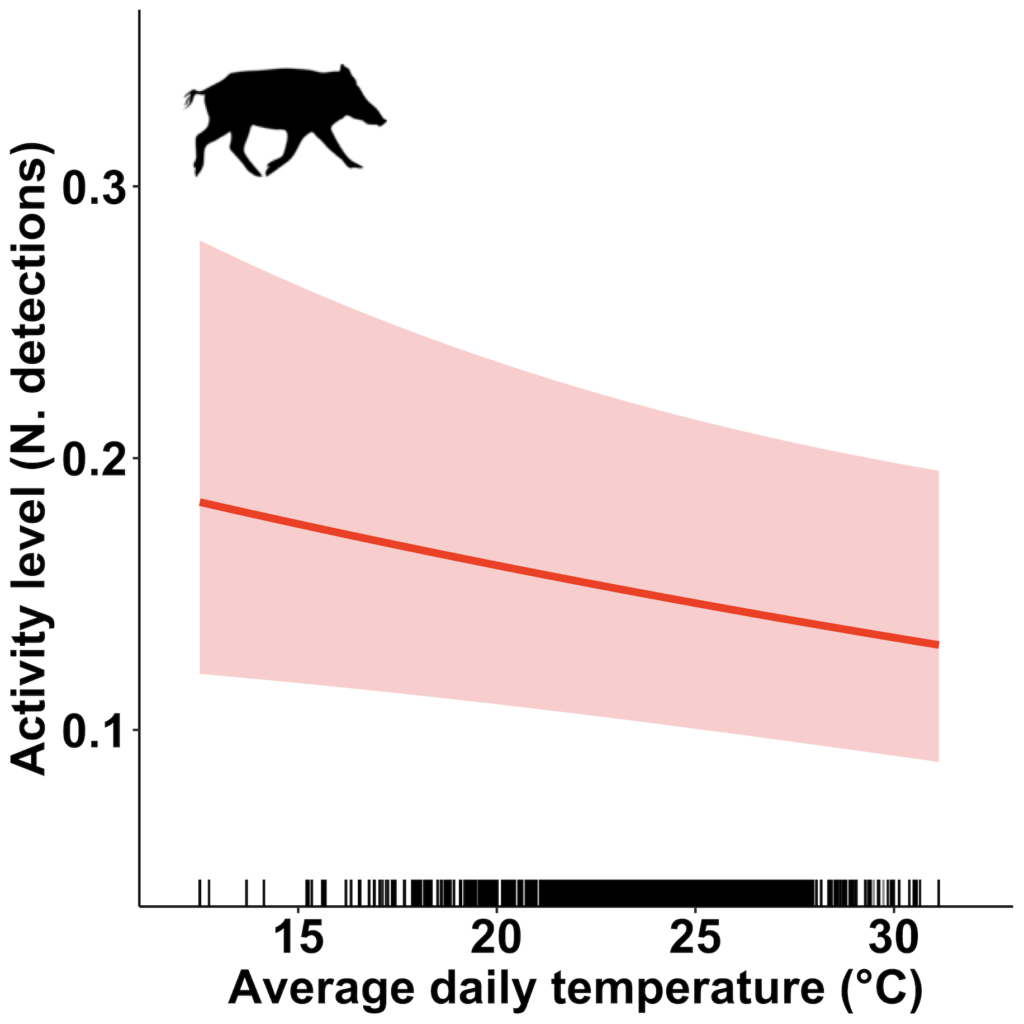
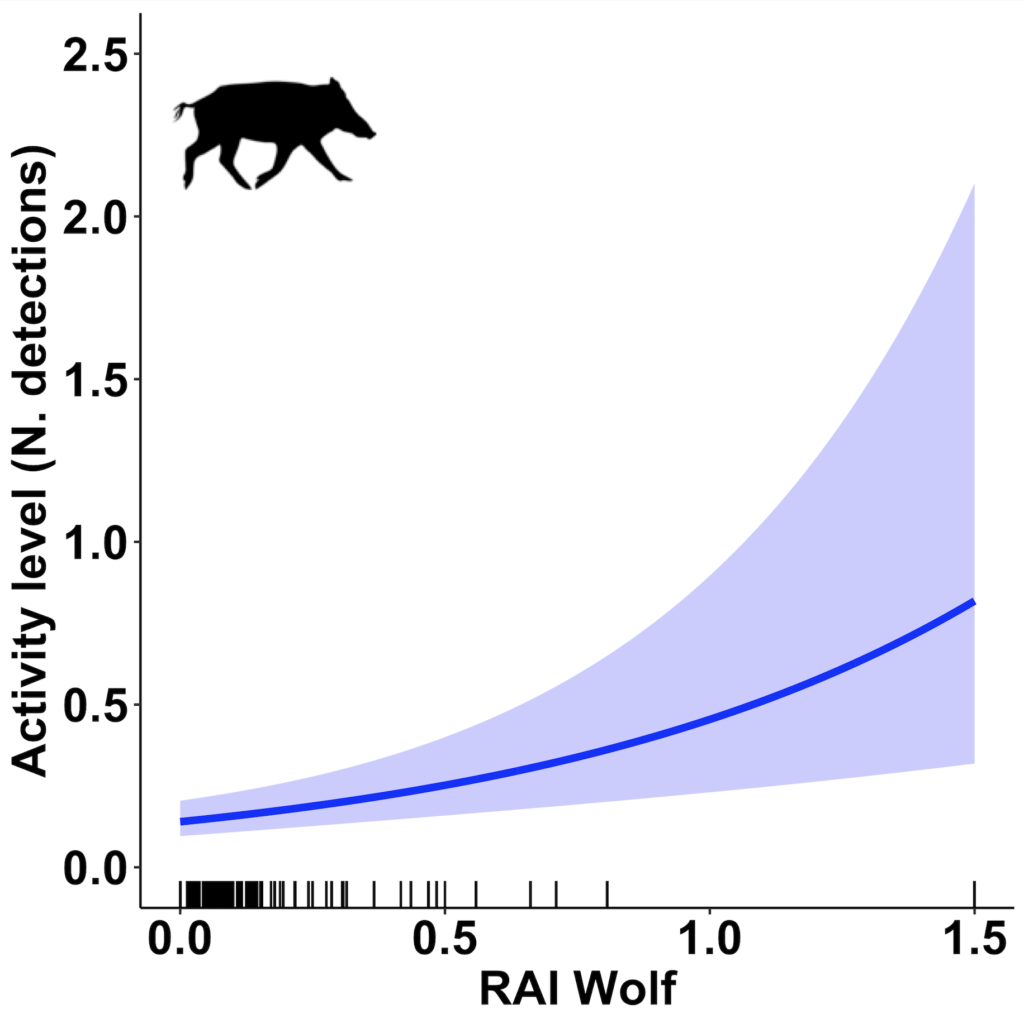
Also wild boar reduced their diel activity level with the increase of temperature (red, on the left). Furthermore, they were more active when a higher number of wolf detections were recorded in the same location (blue, on the right).
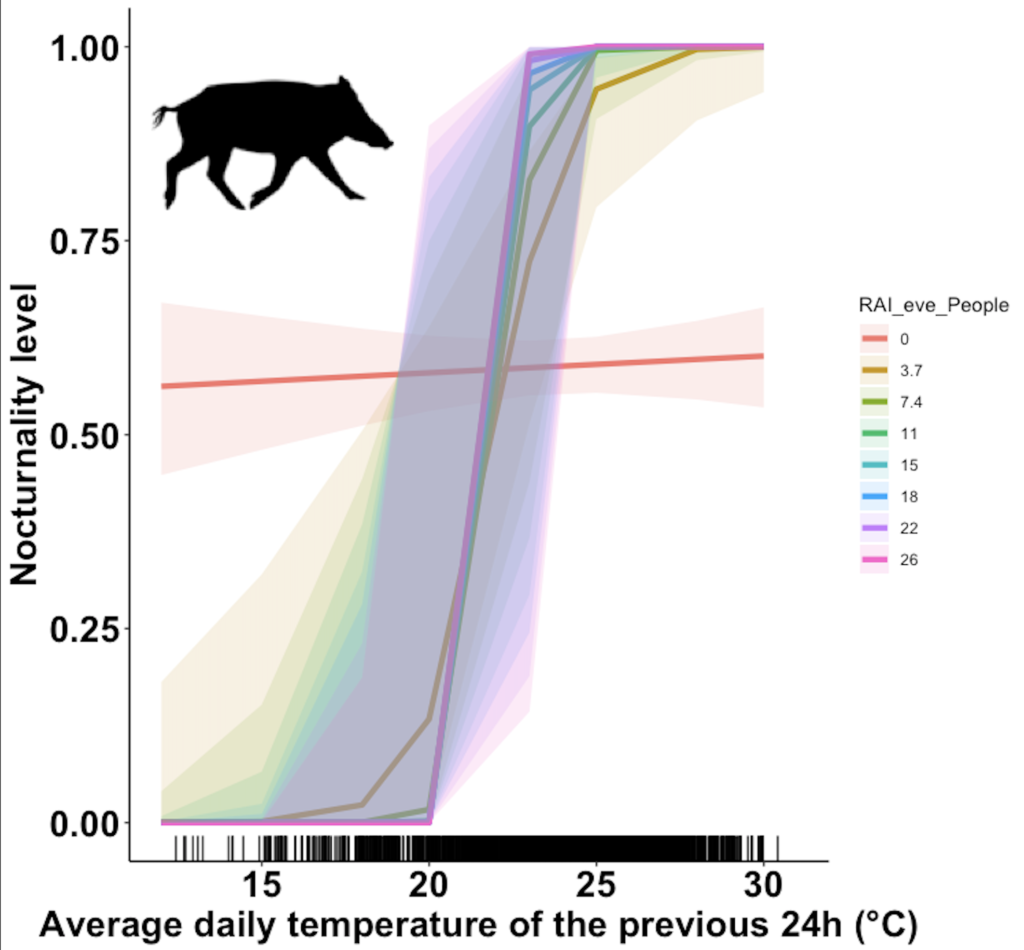
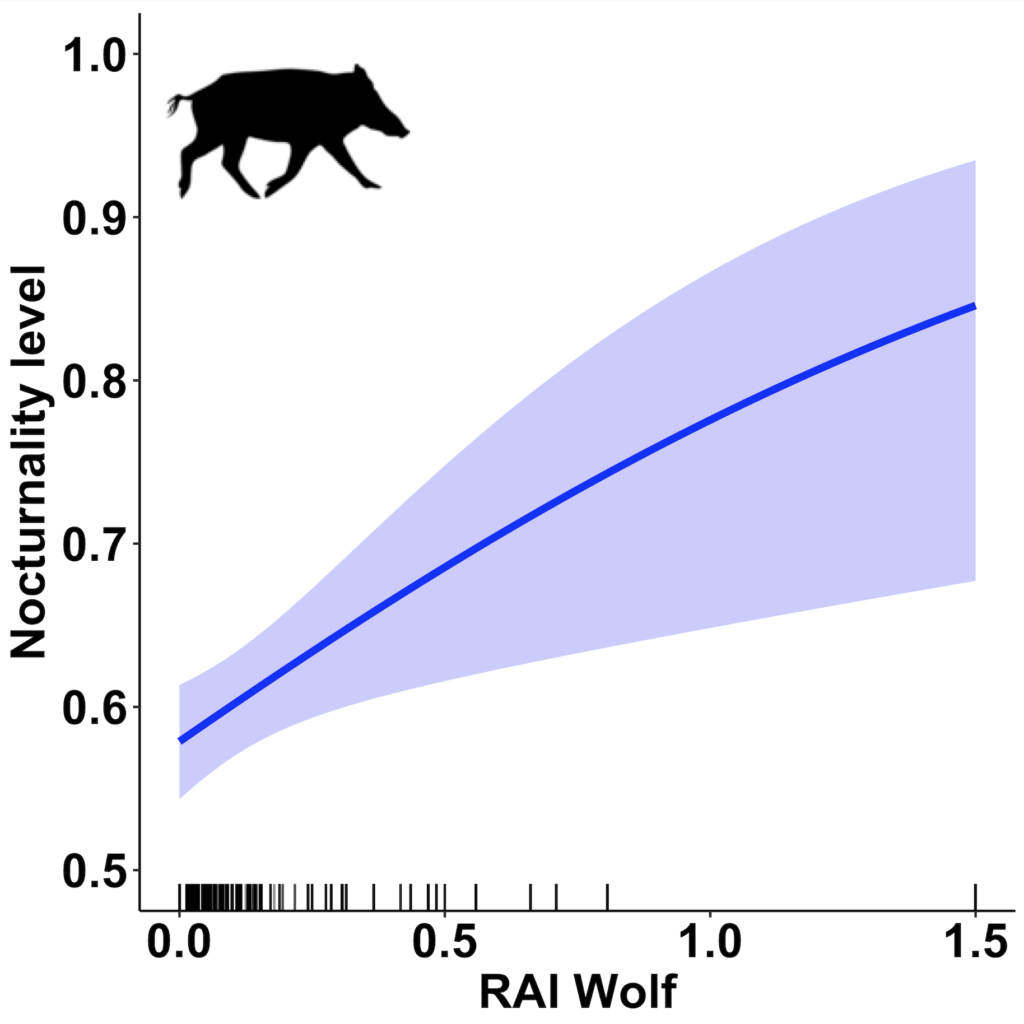
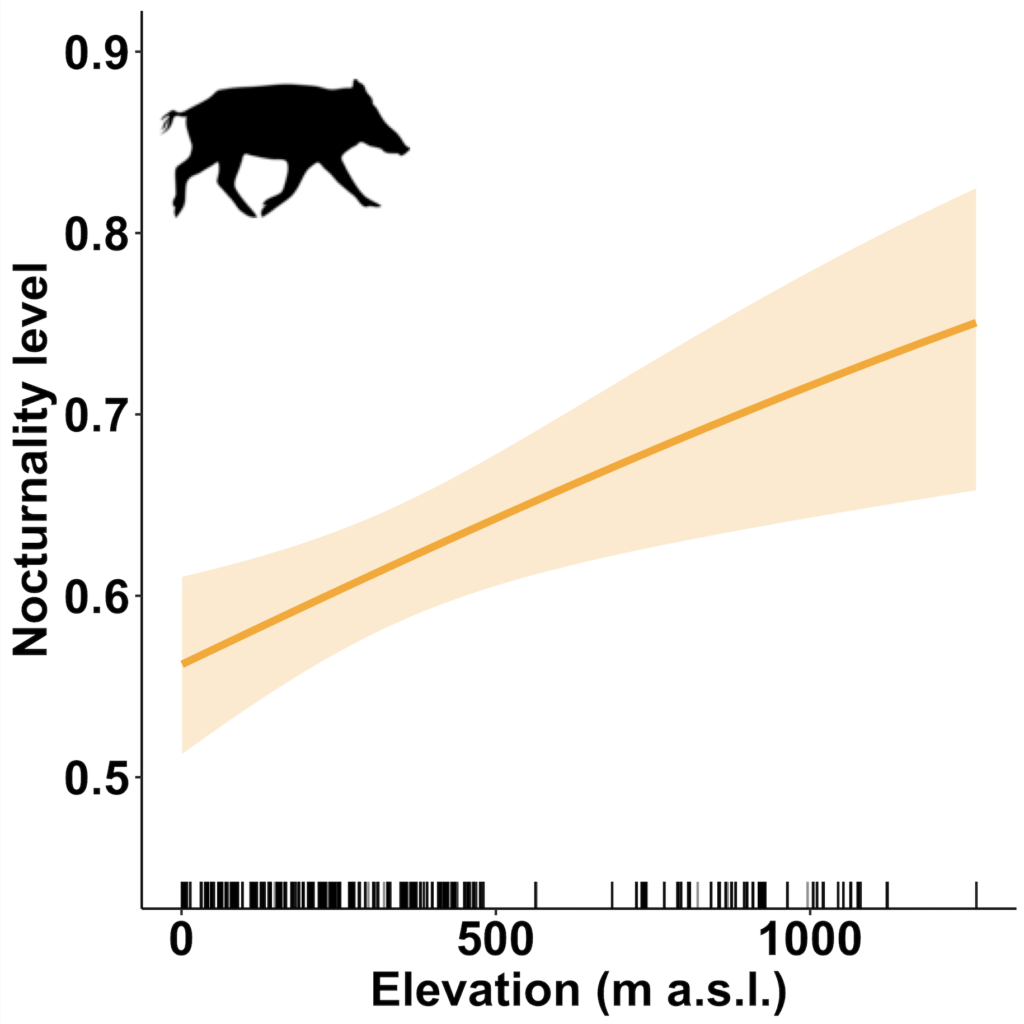
The results from the nocturnal analysis showed that wild boar increased their nocturnality with the increase of temperature; however, this increment was stronger when the detection of humans increased (graph on the left). In addition, when the detection rate of wolves (blue graph in the middle) and elevation (yellow graph on the right) were greater, the nocturnality of wild boar increased.