Species Selection
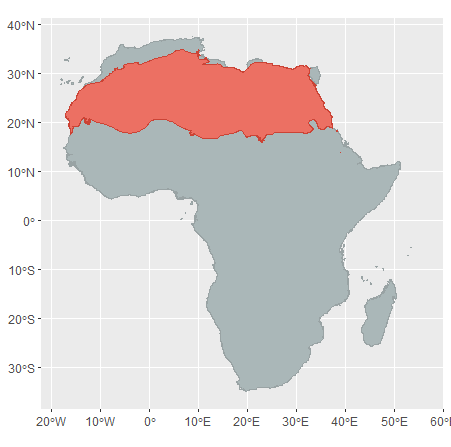
I selected for species with much of their African range being within the Sahara (33+ %) to represent the desert. The selected species consisted of 71 reptiles, 37 mammals, 25 birds and 2 amphibians.

Occurence records (i.e. known present locations of a species habitat) were then obtained for the selected species (as much as I could find..), using free online source like GBIF and iNaturalist.
Variable Selection
I also selected for climatic variables that are most informative for the Sahara, and topographic variables as many desert species are specialised for sandy or rocky substrates. The future global climate models (GCMs) for the climatic variables were then obtained for future predictions.
| BIO1 | Annual mean temperature |
| BIO2 | Mean diurnal range (mean of the monthly maximum temperature – minus temperature) |
| BIO4 | Temperature seasonality (standard deviation x100) |
| BIO12 | Annual precipitation |
| Sand desert | Non-consolidated bare areas |
| Rock desert | Consolidated bare areas |
Species Distribution Models
I made Species Distribution Models (SDMs) using the Maxent algorithm, which is equiped for presence-only data and relatively small data sets (especially useful for the lesser known biodiversity of the Sahara). The SDMs use the occurence records and environmental variables to predict the habitat suitability of each species. After I made the model for each species, I then projected these to different future climatic conditions:
- Realistic-optimistic (CMIP6-SSP2-4.5) near future (2041-2060)
- Realistic-optimistic (CMIP6-SSP2-4.5) far future (2081-2100)
- Pessimisitc (CMIP6-SSP5-8.5) near future (2041-2060)
- Pessimisitc (CMIP6-SSP5-8.5) far future (2081-2100)
Analysis & Assessment
I calculated predicted range loss/gain of suitable habitat using the function “BIOMOD_RangeSize” of the R package “biomod2” for each species. I then compared these results between the species classes, threat status and flagship status. This was done with maps of average suitability and (predicted) species richness, made by averaging the continuous probability projections, and converting each species’ projections into a 0-1 binary scale and, then, summing up the binary projections, respectively.
I further assessed for potential climatic refugia (“safe havens”) and the current protection status of these areas, and the accuracy of flagship representation for the overall Saharan biodiversity to help inform future conservation planning.