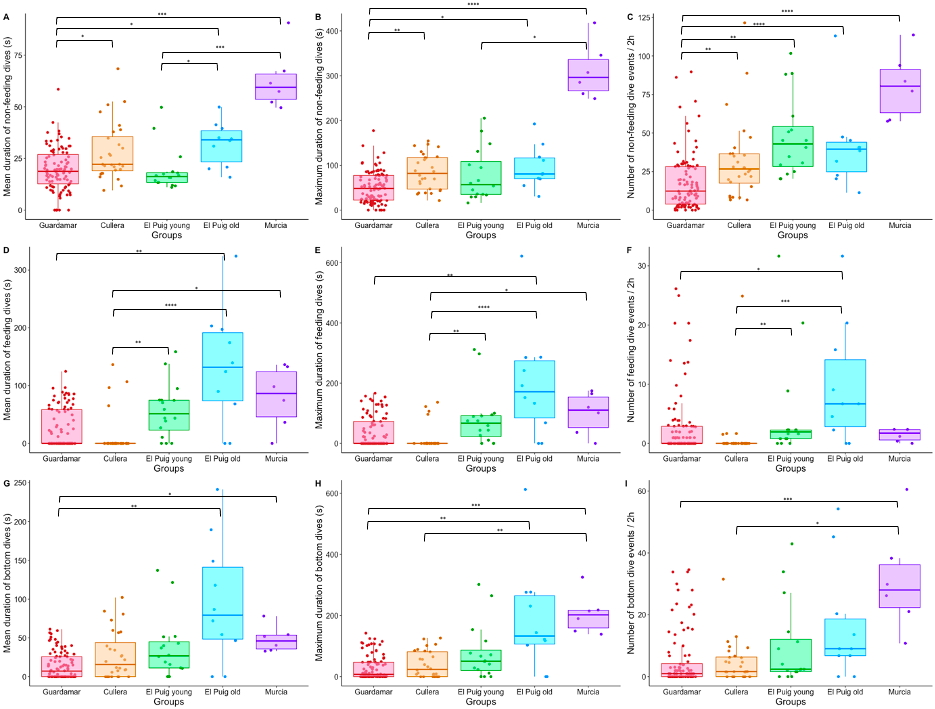
Comparison between groups
As the 28 turtles were part of several HS programs, a comparison between the five groups was made to notice any difference between the groups for the variables observed. Kruskal-Wallis tests were performed and showed that at least one group had a significantly different median from the others. Dunn tests (Bonferroni) allowed to check which group(s) differed for each variable (can be seen on the figure with the significance bars).
Figure: the five groups are displayed from left to right in function of age from youngest to oldest. The significance levels are:* p>0.05, ** p<0.01, *** p<0.001, **** p<0.0001
Diving capacity between birth and 2 years old
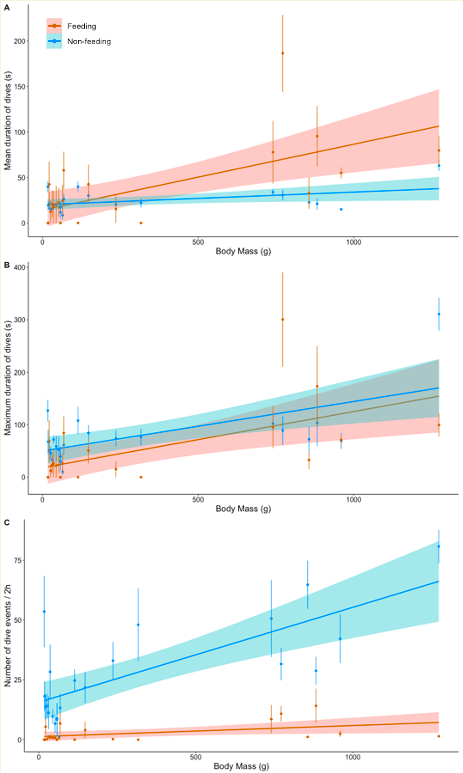
A total of 4709 dives were collected from video footage. 10 diving variables were analysed:
> average percentage of time spent diving
> mean duration of feeding, non-feeding and bottom dives
> maximum duration of feeding, non-feeding and bottom dives
> total number of occurrences / 2h for feeding, non-feeding and bottom dives
Spearman correlation tests were performed to evaluate the relationships between the diving variables and sea turtles’ BM. For all the variables except the mean duration of non-feeding dives, the test results were found significant, meaning there was a positive effect of weight on diving behaviour.
Figure: Diving variables for both feeding and non-feeding dives. Each data point represents the mean value of all the individuals of the group at this session ± se. (A) Mean duration of dives per session. (B) Maximum duration of dives per session. (C) Total number of diving events per two hours.
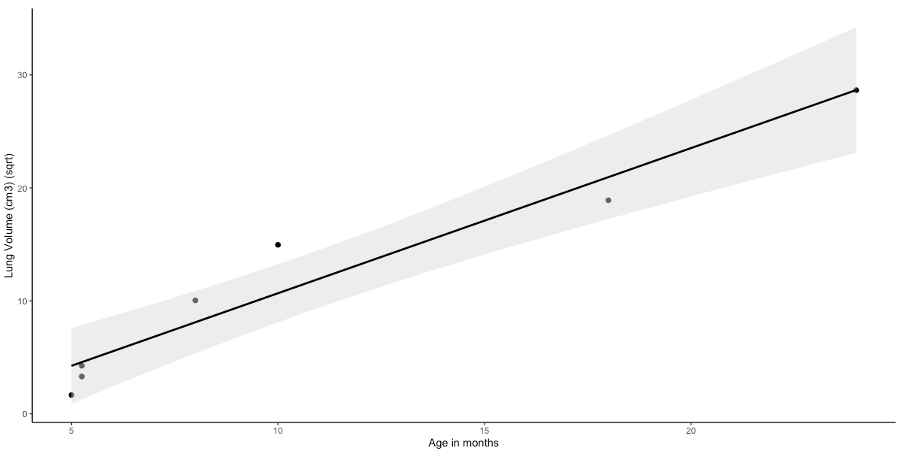
Lung volumes
7 data points could be obtained from CT scans; however the individuals are not necessarily the same as the ones on the video footages.
The relationship between total lung volume and age was found significant, meaning there was a noticeable increase in lung volume with age (linear model, r2 = 0.90, p-value < 0.01).