Species distribution model
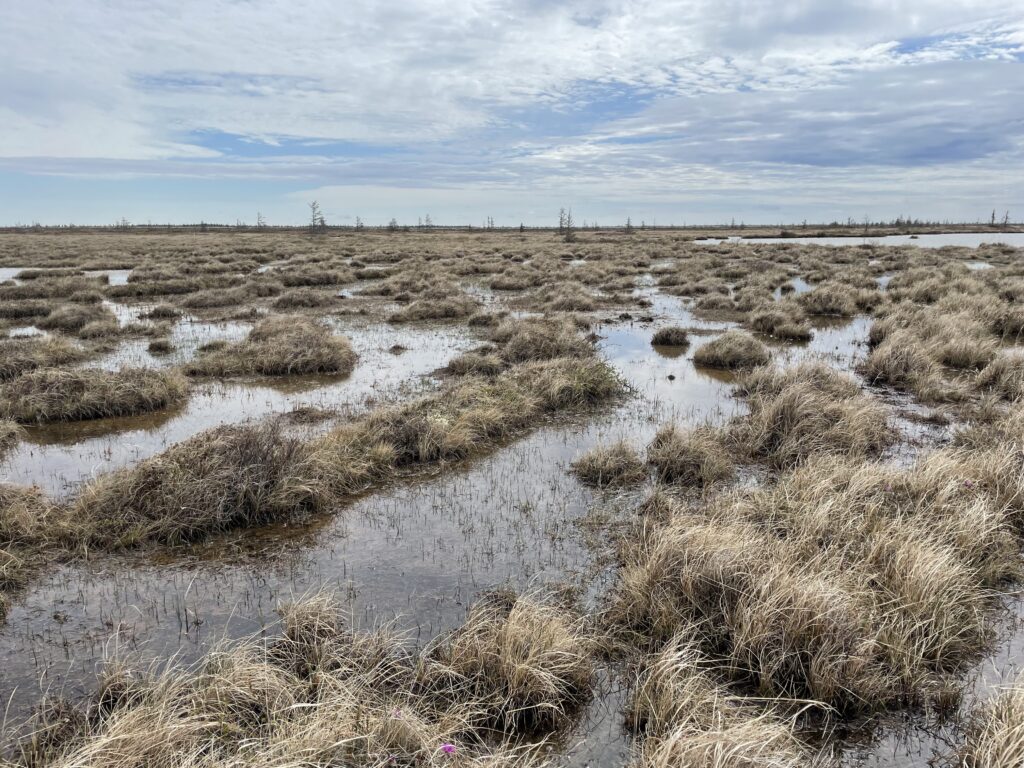
Suitable areas are hard to determine in the field as the terrain is difficult to access and to investigate. Consequently, modelling the species distribution on its breeding ground, with proper design to collect unbiased presence/absence data, would be expensive.
Alternatively, I used the Maxent model, a species distribution model based on presence-only data that can deal with a relatively small data set. Using presence locations of a species and a set of environmental variables, it predicts habitat suitability for a species within a defined landscape. The model is established by contrasting the presence data with a set of background points randomly drawn from the landscape.
Local scale
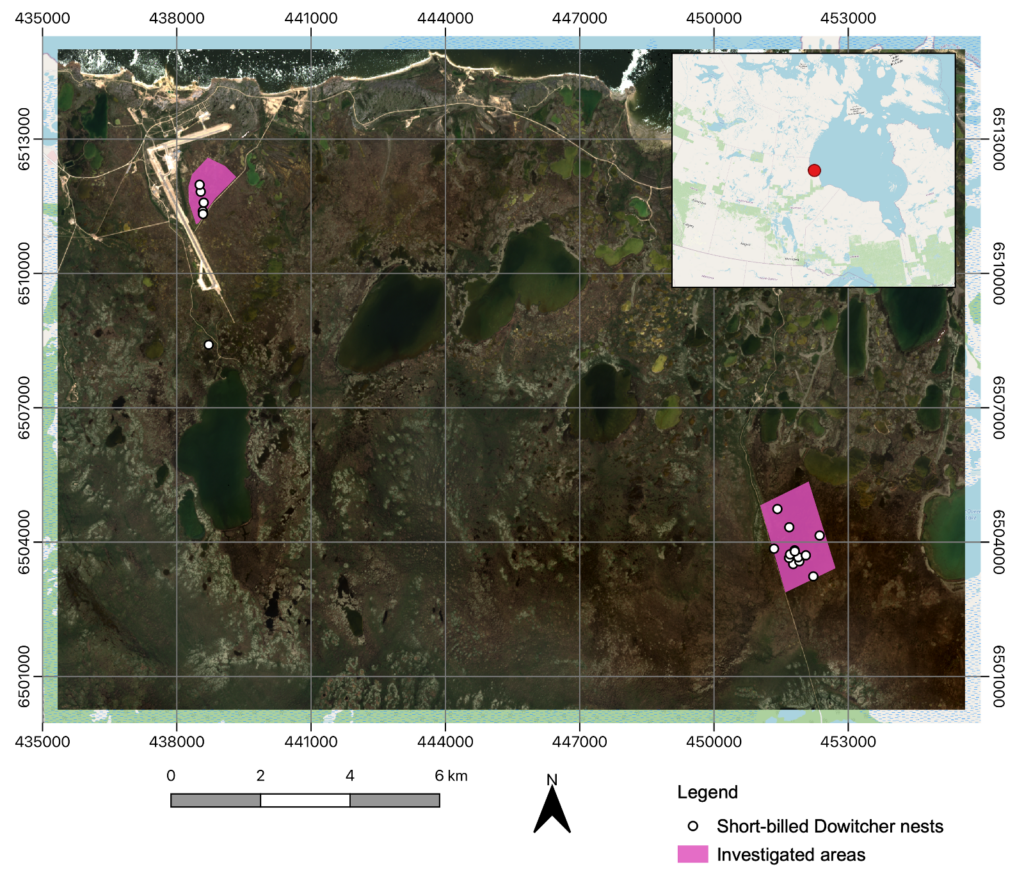
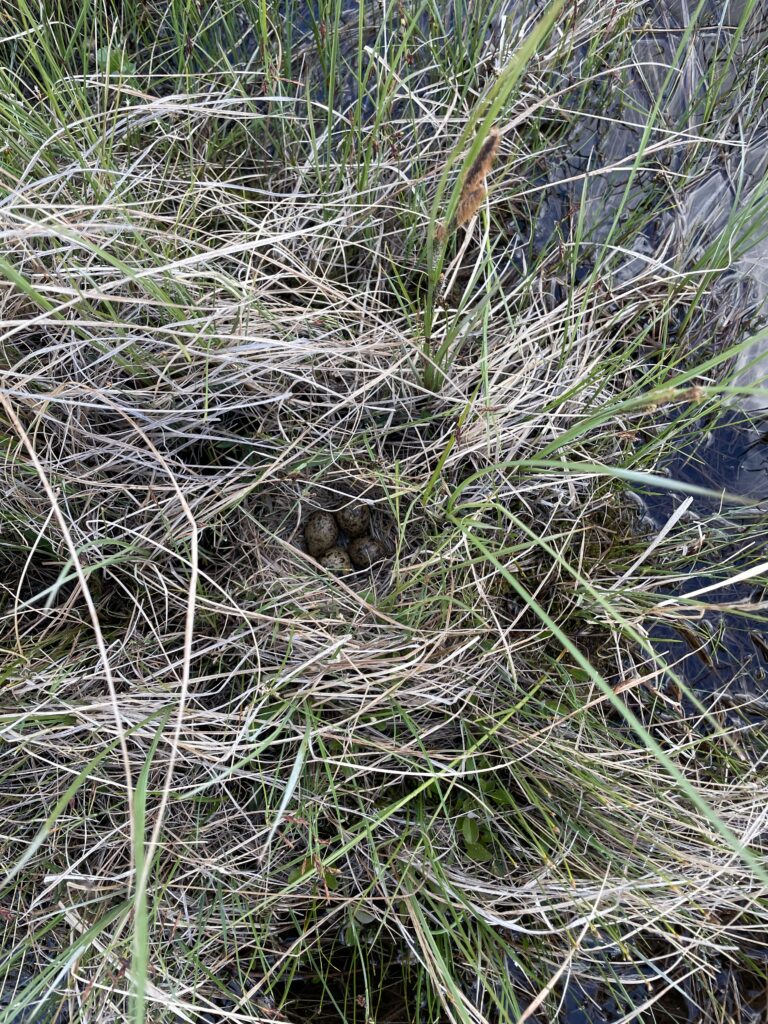
Presence data: During the nesting period, from late May to mid-July, two wet sedge meadow areas were searched. In 2022, 11 nest locations were recorded. I also used the data from 2021 where 8 nest locations were recorded, resulting in a total of 19 nest locations.
Environmental data: For the local scale model, I used 4 environmental variables reflecting the topography and the vegetation structure of the area, derived from remote sensing.
Regional scale
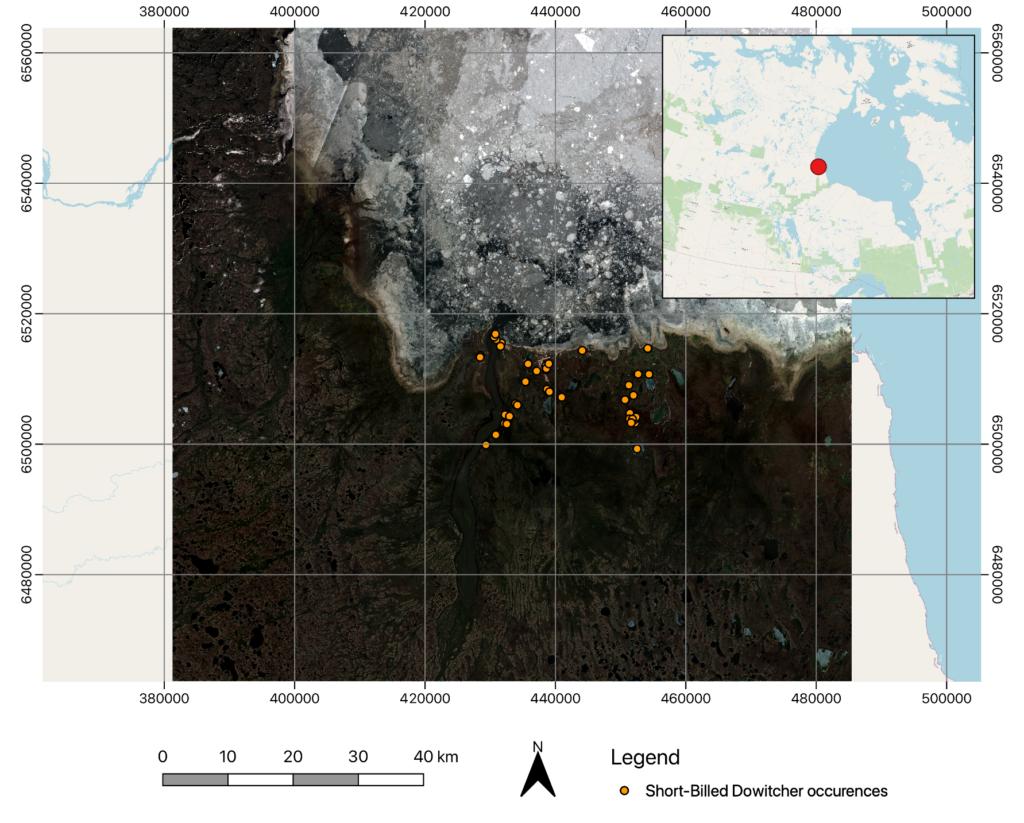
Presence data: The nest locations data combined with eBird data were used for the regional scale model resulting in 48 presence data in total. eBird is a global database of bird observations contributed by bird watchers, scientists, and conservationists to track bird species populations and distribution. I downloaded the eBird basic dataset for SBDO in Manitoba for the years 2021 and 2022 during the breeding period.
Environmental data: For the local scale model, I used 4 environmental variables reflecting the topography and the vegetation structure of the area, derived from remote sensing, and 5 climatic variables.
Environmental variables
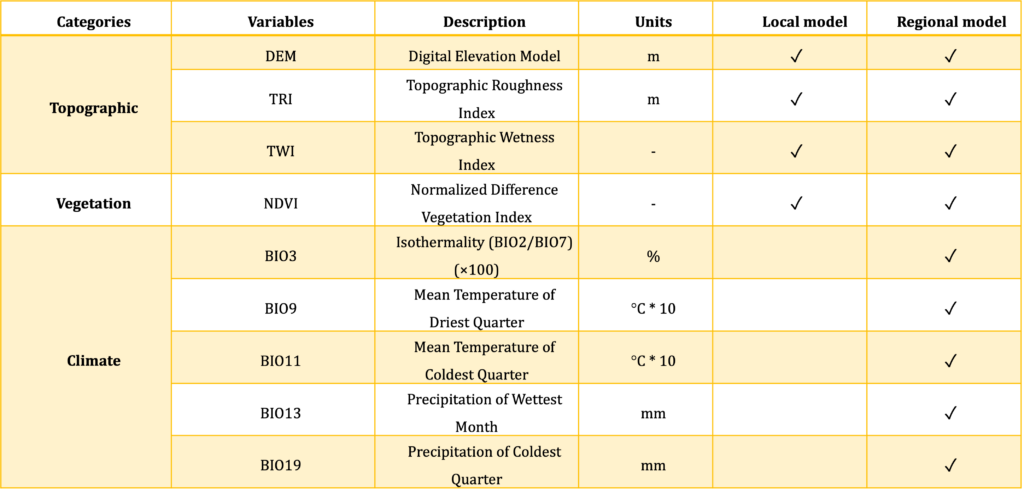
Environmental variables were chosen based on what is already known about the species’ nesting site preferences and reflects some aspects of the topography, vegetation, and climate.
The realism of any species distribution model depends on the use of ecologically meaningful predictors for the species.
Shorebirds nesting on the ground tend to establish their nests on areas with a low terrain roughness as it is associated with a better anticipation of predators. A low elevation, associated with a wet soil is expected to describe the shorebirds distribution in the Arctic. The Topographic Wetness Index is used to assess the potential wetness of an area, and the Normalized Difference Vegetation Index is a proxy for vegetation structure and food availability. These variables are expected to influence the distribution of SBDO on their breeding ground.