Step 1 – Hatching chicks:
- 78 White Leghorn chicks were hatched at Linköping University, Sweden. The chicks were hatched and removed from the hatcher in darkness to prevent imprinting.
Step 2 – Filial imprinting procedure:
- Directly after hatch, the chicks were equally divided into an experimental group and a control group.
- The experimental group was placed in imprinting boxes for the filial imprinting procedure (Figure 1). A stuffed hen was attached to a rotating plate that was placed between the imprinting boxes. A speaker was put behind the model hen and it played a repeated recording of a hen tidbitting towards her chicks (Figure 2). Each session lasted for 90 minutes.
- The control group was placed in a box in a separate room, also for 90 minutes per session, but in total darkness.
- After the chicks were finished with their sessions, they were placed in home pens (2 home pens for the imprinted chicks and 2 home pens for the non-imprinted chicks).
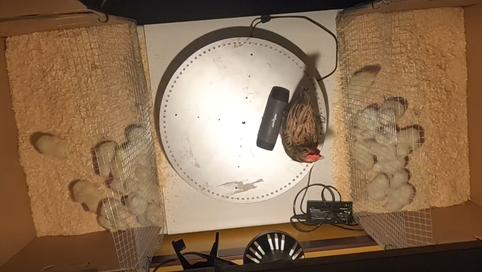
Figure 1. The filial imprinting set-up.
Figure 2. The tidbitting sound played from the speaker.
Step 3 – Judgment bias test:
- A judgment bias test (JBT) was performed on the chicks at the age of 1 week and it was replicated at the age of 5 weeks, to examine optimism and pessimism.
- A test arena was built out of cardboard. The inside consisted of a start area with a removeable door, leading to an alley with a stimulus area at the end, a wire net wall, and a conspecific area (Figure 3).
- Each trial began with placing one chick in the start area, and after 10 seconds, the door was removed. The chick was then allowed to move to reach the conspecific area. Chicks were placed in the conspecific area to serve as social attraction.
- The chicks were first presented with a mirror (most positive stimulus) to remove unmotivated chicks. Thereafter, the chicks were presented with either a chick picture (positive stimulus), or an owl picture (negative stimulus). Lastly, the chicks were exposed to a morph picture between the chick- and the owl picture (ambiguous stimulus; Figure 4).
- The latency to start walking towards the stimuli and the latency until passing the stimuli, was recorded in seconds.
- The chicks had 5 minutes to finish the test.
- During the replication of the test, a prebuilt cardboard arena was used (60 x 102 x 35 cm).
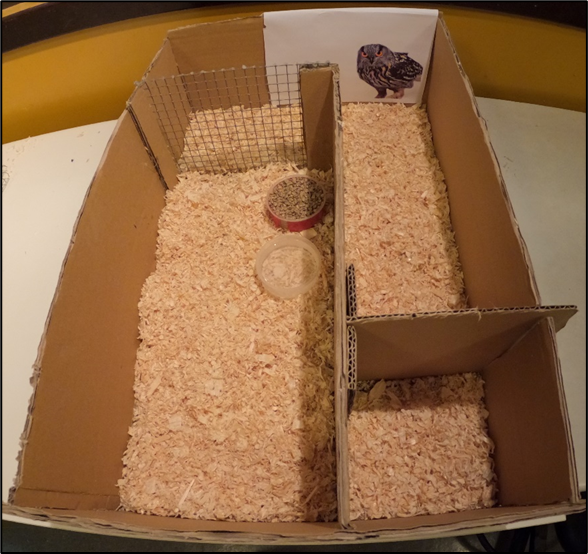
Figure 3. The judgment bias test arena (36 x 55 x 16 cm) used at 1 week of age.
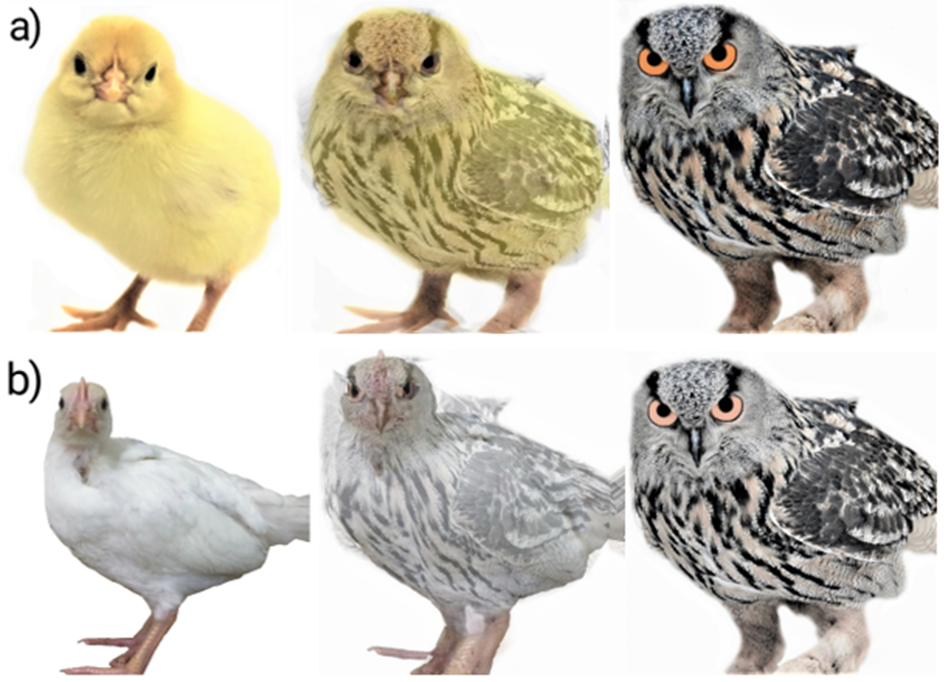
Figure 4. Stimuli used for measuring cognitive judgment bias at a) 1 week of age and at b) 5 weeks of age. Copyright 2021, copyright Louise Hedlund.
Step 4 – Open field test & Novel object test:
- To examine fear response, an open field test (OFT) and a novel object test (NOT), were performed at 1 week of age, and the tests were replicated at 6 weeks of age.
- A test arena was built out of cardboard, which was empty and novel to the chicks during the OFT. In the NOT, a novel object was added in the middle of the arena. Shower curtains were hung around the arena to hinder any distractions from the surrounding area (Figure 5).
- Each OFT-trial began with placing a chick in the middle of the arena, where it was left alone to be filmed for 10 minutes.
- Directly after every OFT-trial, the lights were turned off shortly to place the novel object in the arena, which was a blue rubber ball or an orange cone (replication; Figure 6). Each NOT-trial started when the lights were turned on and the chick was left alone to be filmed for 5 minutes.
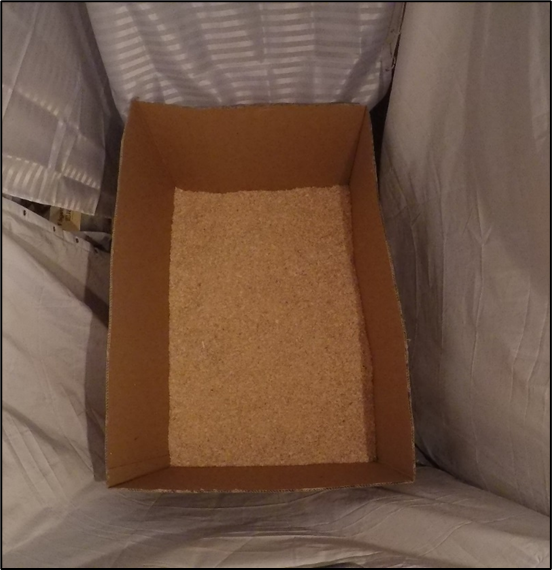
Figure 5. The arena (115 x 150 x 62 cm) used in the open field test and novel object test at 1 and 6 weeks of age.
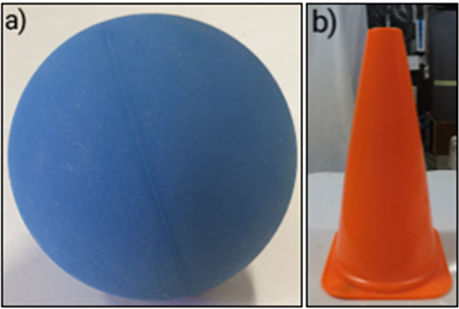
Figure 6. The novel objects used at a) 1 week of age (a blue rubber ball, diameter: 5 cm), and at b) 6 weeks of age (an orange plastic cone, 17.5 x 17.5 x 30 cm).
Step 5 – Weight:
- All chicks were weighed once a week for 7 weeks, as part of the project.
Open field test and novel object test video analysis
- After filming, the videos were analyzed. Specific behaviors were chosen (Table 1; Table 2). Some of the behaviors were analyzed using imaginary grid patterns. All grid patterns were divided into nine equally sized squares with a circle (“start circle”) in the middle (Figure 7).
Table 1. Ethogram used during analysis of the filmed videos of the open field test.
| Behaviors | Description of behaviors |
| Escape attempt | Number of times attempts were made at jumping out of the arena. |
| Activity: line cross | Number of times an imaginary line (grid line) was crossed by the center point of the chick’s body. |
| Latency to leave start circle | Time taken for the center point of the chick’s body to leave the start circle. |
Table 2. Ethogram used during analysis of the filmed videos of the novel object test.
| Behaviors | Description of behaviors |
| Escape attempt | Number of times attempts were made at jumping out of the arena. |
| Activity: line cross | Number of times an imaginary line (grid line) was crossed by the center point of the chick’s body. |
| Novel object peck | Number of times the novel object was pecked. |
| Time spent in start circle | Time spent in the start circle. When the center of the chick’s body was inside of the start circle, the chick was regarded as being inside of the start circle. |
| Latency to start walking after lights were turned back on | Time taken to start walking after the lights were turned back on. |
| Latency to peck novel object | Time taken to begin pecking the novel object. |
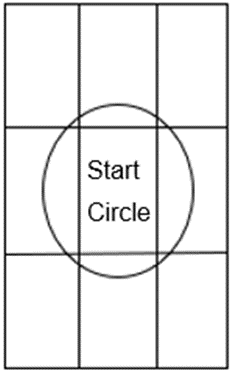
Figure 7. Illustration of the general grid pattern used when analyzing some of the behaviors in the OFT and NOT videos.
Data analysis
- Generalized linear mixed models were used to analyze the data from all experiments, the JBT, the OFT, the NOT, and the weight.
- For the JBT, OFT, and NOT, the Bonferroni correction method was used to reduce the risks of obtaining false-positive results. What one obtain, is a Bonferroni-corrected p-value for each behavioral test.
- Bonferroni-corrected p-value for JBT: 0.025.
- Bonferroni-corrected p-value for OFT: 0.0166666667.
- Bonferroni-corrected p-value for NOT: 0.0125.