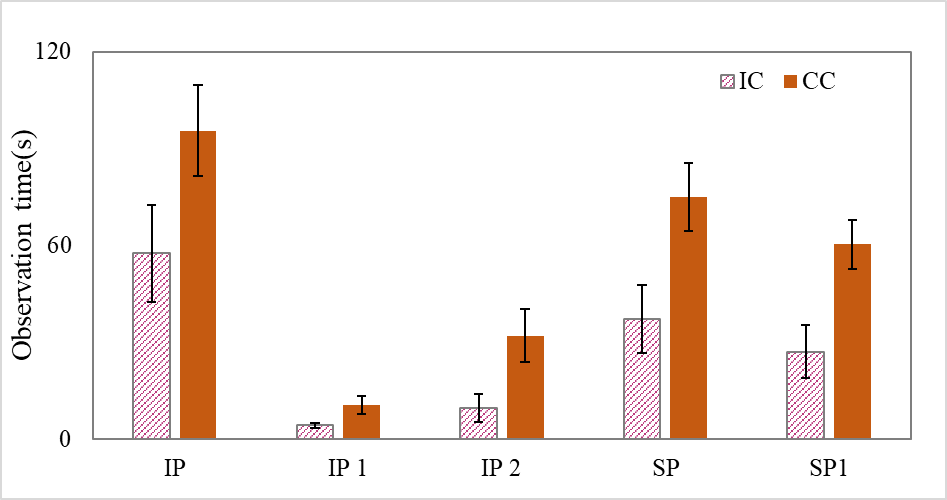
Latency
In imprinting preference test, the results showed that imprinted chicks significantly presented a shorter latency value to initiate moving to the imprinting stimuli than the control group (p=0.0.37; Figure 5.). After two more replications, latency values were consistent in deacresing trend (p=0.018, for the first replication; p=0.007, second replication; Figure 5.)
In Social Prefence Test, the latency was highly significant between treatments (p=0.007; Figure 5.) and got shorter after replication(SP1) (p=0.002; Figure 5.).
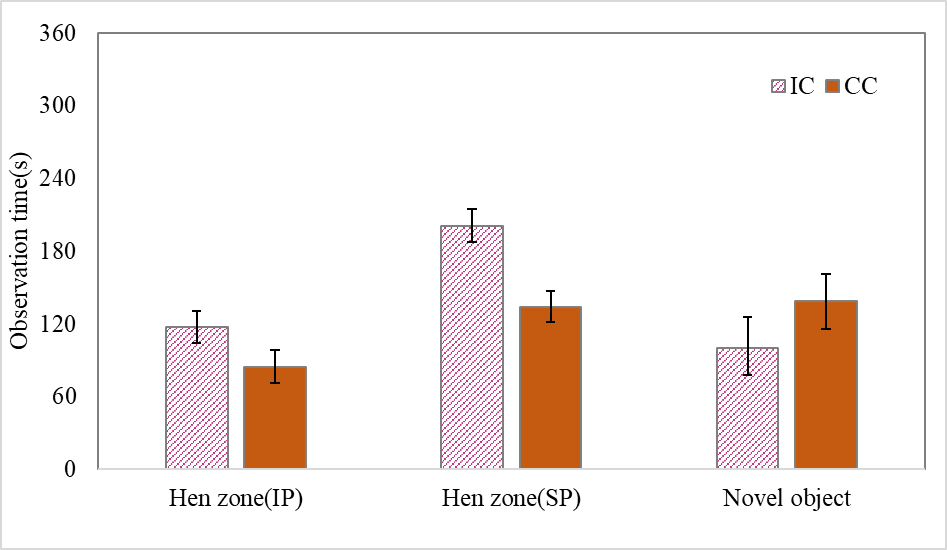
Spent time in novel object and Imprinting stimuli
In both Imprinting Preference and Social Prefence Tests, there was a significant difference in time spent in the hen zone. Imprinted chicks spent more time in the hen zone where the imprinting stimuli were (p=0.050, IP; p<0.001, SP; Figure 6.).
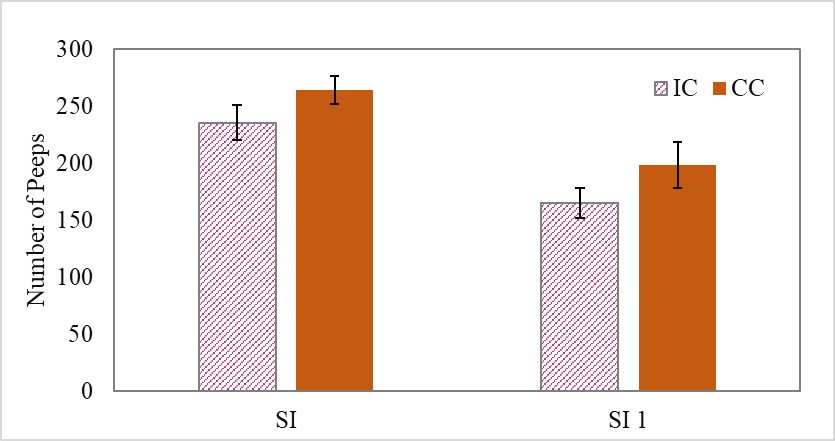
Peeping frequency
Results showed that there was not any significant results among treatments as well as after replication of the experiment, however, a decrease in peeping calls by imprinted chicks ( ; p=0.073)