Percentage of correct answers
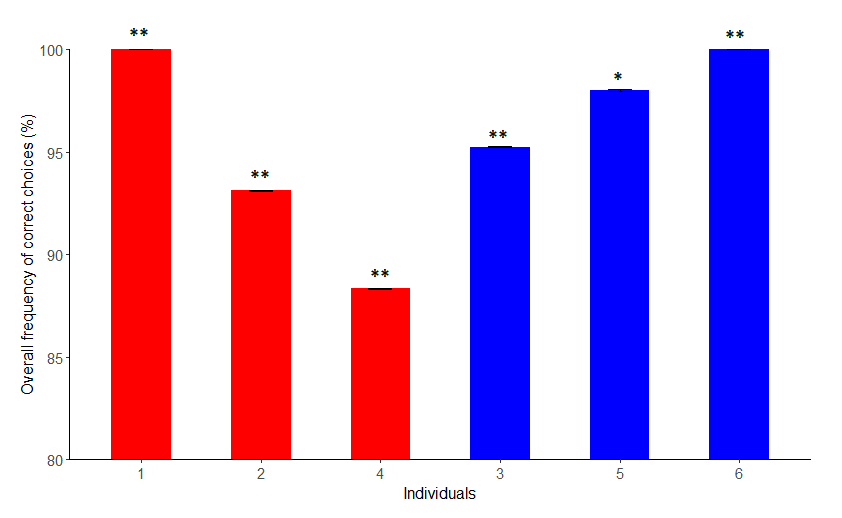
An exact binomial test with exact Clopper-Pearson 95% confidence intervals (CI) was used for each individual turtle and condition to determine if the turtles chose a greater proportion of reinforced or non-reinforced colours. Out of the 6 individuals, all could significantly discriminate between red and blue and scored above 85% of correct choices (Fig. 1).

Turtle 1 was also tested using three targets, two with the incorrect and one with the correct colour. Statistically, this would provide a higher certainty that the turtle was not choosing the reinforced colour only by chance. While using three targets, turtle 1 chose the reinforced colour 99.5% of the time (n = 42, p < 0.01).
Comparison between colour groups
After confirming that the data was normally distributed an independent t-test showed there were no significant differences (t(2.65) = 1.075, p-value = 0.37) between the red group (x̄ = 93.81%, SD = 5.87) and the blue group (x̄ = 97.75%, SD = 2.39).
Learning speed
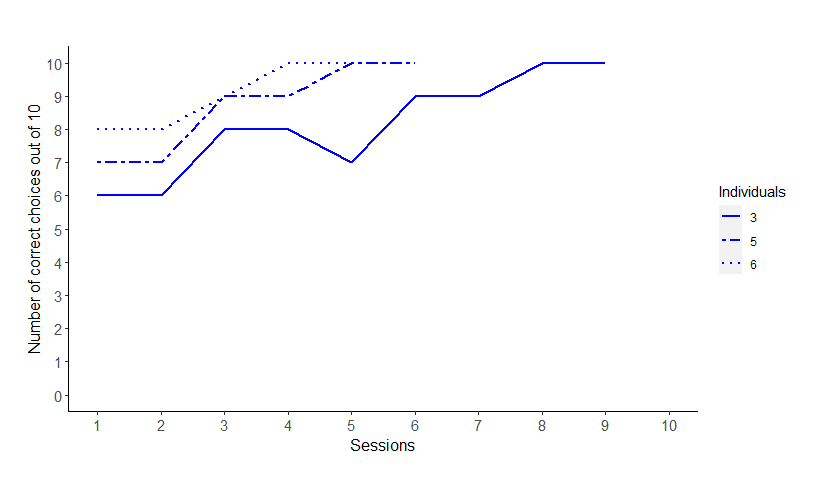
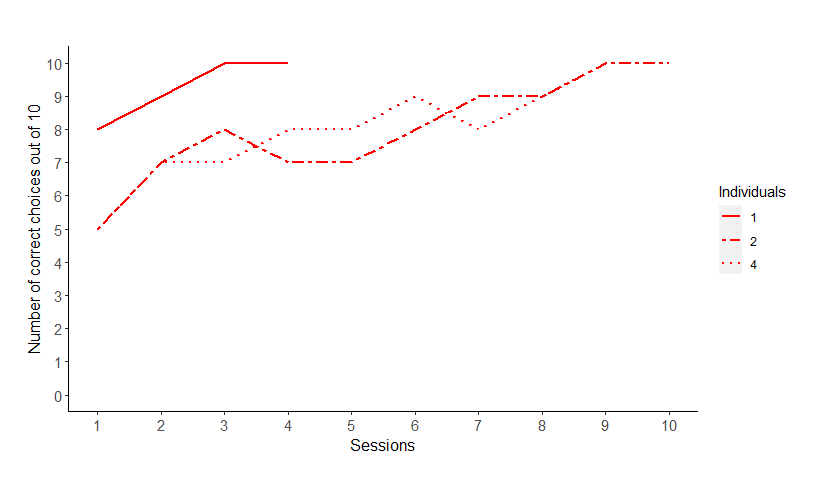
The turtles needed a median of 7.5 sessions and 62.5 trials to meet the learning criterion (SD = 1.32, range of 37 – 81 trials, Fig. 2 & 3). No statistical analysis could be done to determine whether there was a significant difference between the turtles that had red as a rewarded colour and those that had blue.


Go to Discussion