Research animals and facility
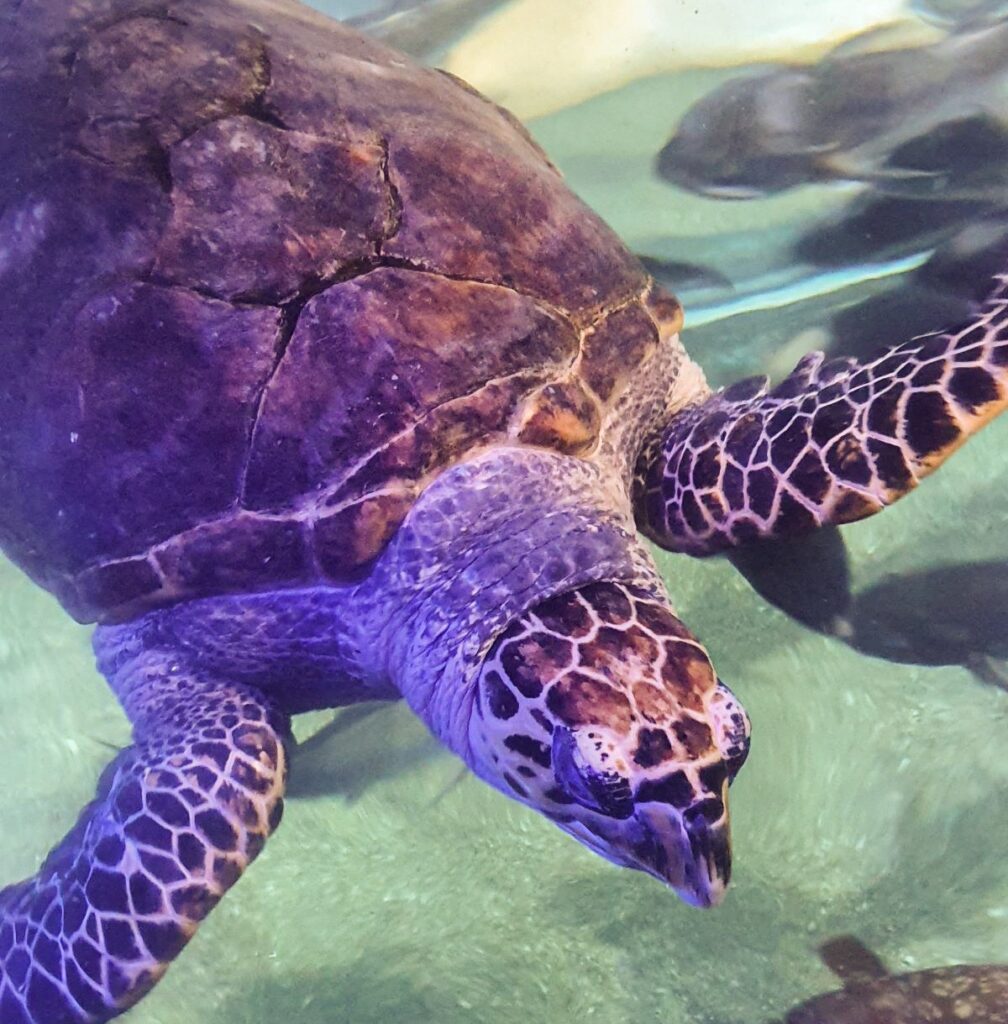
The study was done at Oceanogràfic, Valencia in Spain from July 2022 to December 2022. Six individuals were used, five of which were green turtles (Chelonia mydas) and one was a hawksbill turtle (Eretmochelys imbricate). Two turtles were females, while for the rest, the sex was unknown. The green turtles’ curved carapace length (CCL) ranged from 32.5 to 101 cm (mean CCL ± SD = 55.2 ± 28.3 cm). The hawksbill turtle measured 81 cm in CCL. Four turtles were part of mixed exhibits, while two were housed in individual tanks within the quarantine. The turtles were fed once a day, two to five days a week. The hawksbill turtle had keratitis in the left eye, which compromised the vision, although the extent was not known.
Colour stimuli
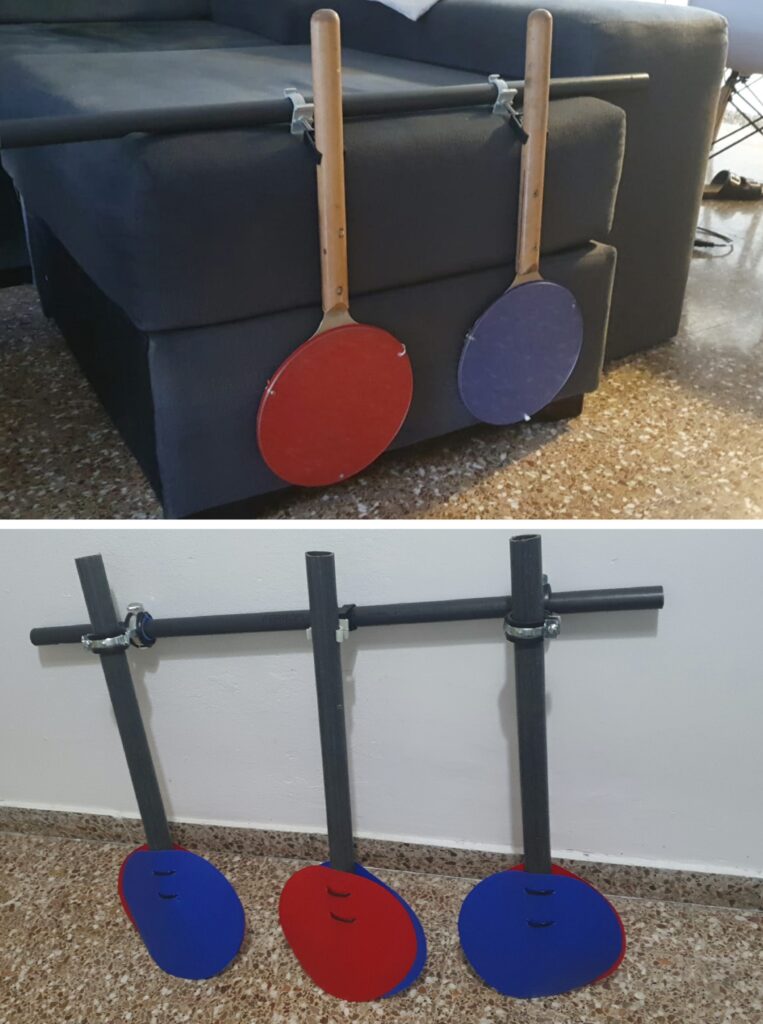
Blue and red were selected as the two colours to be tested as they represent the ends of the spectrum of visible light with shorter wavelengths between 400 – 490 nm (blue) and longer wavelengths between 635 – 700 nm (red). One-millimetre-thick coloured plastic circles were used as targets instead of printed paper. The coloured plastic was sandwiched between round metal paddles and a thick piece of Plexiglas for extra security. When using three paddles, they were modified and made out of plastic tubes to make them lighter and easier to hold with one hand. The paddles were secured in a structural array and held by the trainer to avoid inadvertently cuing to the animals. The paddles measured 20 cm in diameter and were placed 30 cm apart. They were always presented to the turtles submerged just under the surface of the water. At this shallow depth, it was assumed that specific wavelengths of colour were not filtered out and the turtle saw the same colour as above the surface.
Experimental design
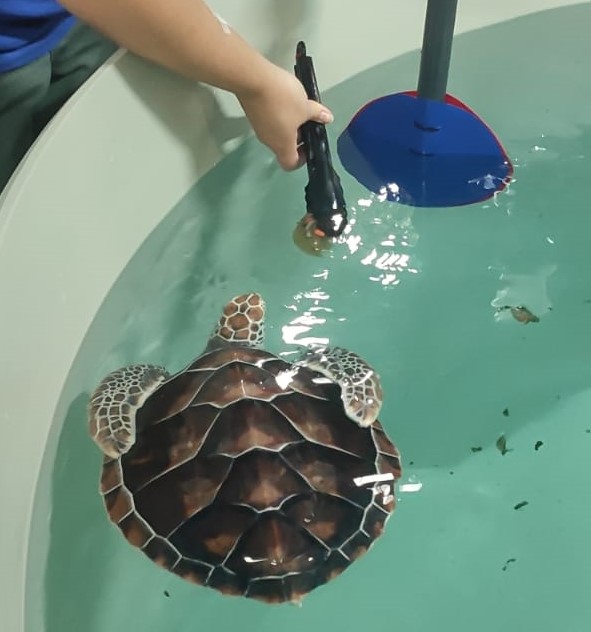
The training and testing were done during the turtles’ regular feeding times, therefore, they were trained between two and five times a week depending on the individual. The turtles were randomly allocated either red or blue as their reinforced (or correct) colour. Each turtle was then individually trained using positive reinforcement and choice-based target training to approach and touch either a blue- or red-coloured paddle. As most subjects had not been target-trained before this study, there was an initial period that required training for each turtle to understand the task. The reinforced colour was first used by itself to train the turtles to touch the target with their beak and get rewarded with food. A bridge stimulus in the form of a whistle was used to better pinpoint the correct behaviour and enhance the learning pace. When a turtle touched the target, it was rewarded with a small portion of its daily meal.
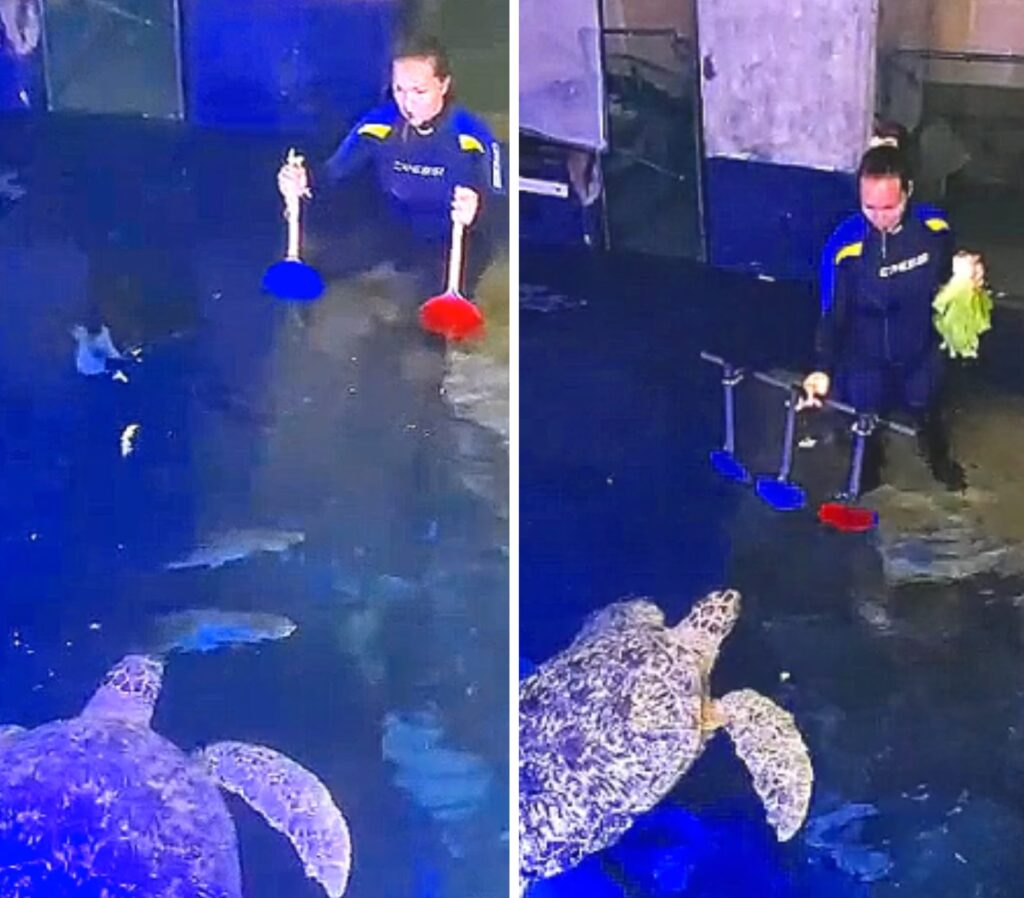
Once this behaviour was mastered, both colours were presented. This was done to help desensitise the turtles to the second colour and minimise the novel object curiosity during the testing phase. Whether each colour was presented on the left or right side was pseudorandomised to prevent the turtles from learning patterns. If the turtle touched the correct colour, it again received a small portion of its daily meal as a reward. If it touched the incorrect colour or no response was given, the turtle did not receive a reward and after a 30-second break, the targets were presented again.
The procedure was the same during the testing phase, however, the responses of the turtles were then recorded. Since the turtles were choosing between two targets, the probability of them choosing the correct one by chance was 0.5. With one individual, three targets were used (two with the incorrect colour and one with the correct colour) which lowered the probability of it choosing the correct colour by chance to 0.33.
Statistical analysis
Percentage of correct answers
The turtles’ responses were recorded as either 1 if the correct colour was chosen or 0 if the incorrect colour was chosen or no response was given. The data was collected during 10 to 40 sessions depending on the individual with 10 trials being recorded per session (one trial = one time the targets were presented to the individual). The results were then expressed as the frequency of a correct choice (in percentage) for each individual. Data was analysed using a one-sample binomial test with the significance level set at p < 0.05.
Comparison between colour groups
To test whether there was a difference in performance between the individuals of the two colour groups, an independent t-test was done using the overall frequency of each turtle after testing the normality of the data.
Learning speed
The speed at which the turtles learned to discriminate between the targets was also investigated. This was done by calculating how many sessions and trials it took from the first time the turtles were shown both colours until the learning criterion was met.
Go to Results