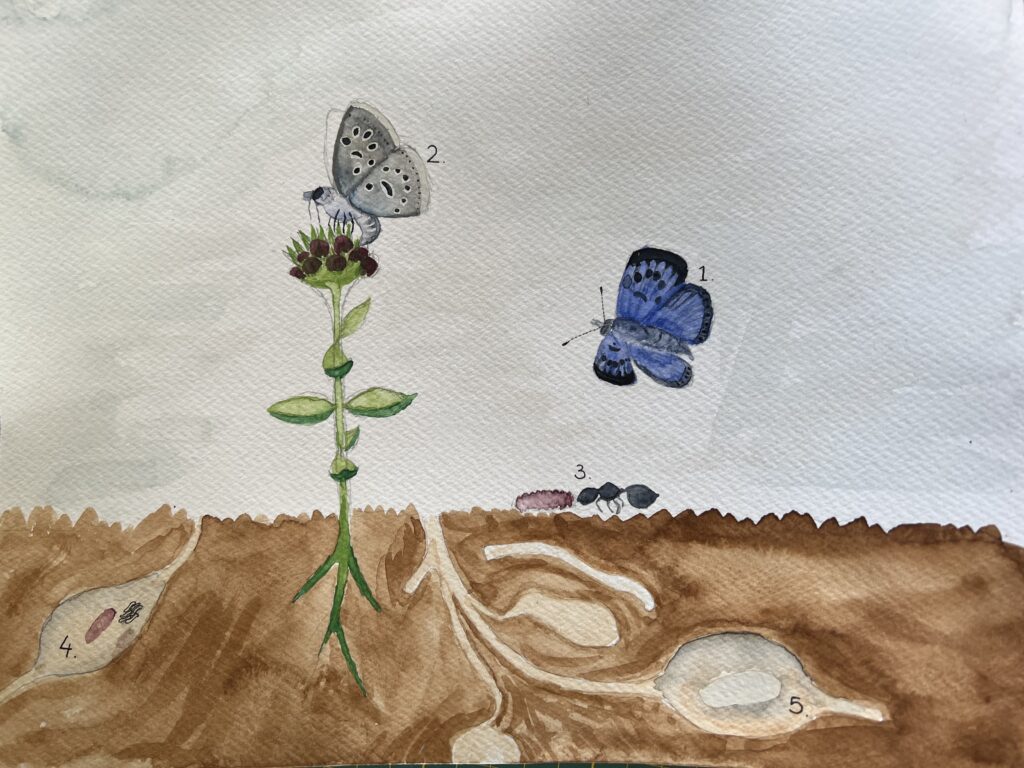
Phengaris arion lives all across Europe, in the northern distribution range the host plant is Thymus serpyllum. Adult butterflies emerge in mid-June and fly until early August. P. arion caterpillars hatch during August and spend their first molting periods on the host plant. The caterpillar drop to the ground and starts to mimic larvae of an Myrmica spp. ant. This tricks foraging Myrmica spp. ant workers into bringing the P. arion caterpillar to their nest. Within the Myrmica spp. nest the caterpillar lives as a social parasite on the Myrmica colony, eating ant larvae, eggs and pupae during winter until it pupates.
1.2 Study area
The study area is located on the island Gotland (Sweden), in the southern Baltic sea. The area is close to the village Slite. The population of P. arion has been monitored in the same way in Slite since 2018. The monitored area have not been the same all four years due to changes in focus of previous research (see maps below). The monitored areas were evaluated and chosen based on satellite pictures and field experience of the area.

Mark release recapture (MRR)
To map the distribution and numbers of individuals of the population for year 2021, a Mark release recapture method (from now on called MRR) was used. The MRR was done during days with moderate wind, above 17°C during sunny days and above 26 °C during cloudy days. The GPS points was associated with canopy cover data and a ground moisture index (GMI) downloaded from the Swedish Nature Conservation Agency (Naturvårdsverket). These habitat preferences were then compared with data collected in the same way previous years.

1.4 Small scale habitat preference
During the MRR, additional data for small scale habitat preferences was collected for 75 of the marked individuals. These individuals were caught during the first part of the flying season and were evenly distributed throughout the searched area. As an individual was caught and marked, additional variables were noted in a 0,8 diameter circle and a 10×10 m square (picture below) surrounding the marking spot. To be able to compare the variables for squares where individuals were found with the rest of the landscape an additional 54 random spots were created in online GIS. These 54 squares were then visited and variables were taken in the same way as for a marked individual. After the data was visited in field, GMI was added for each GPS location. Data for GMI was taken from Naturvårdsverket.

Canopy cover of woody vegetation below three meters in north and east were summed up and subtracted with canopy cover of woody vegetation in south and west direction. For each circle, Thymus serpyllum abundance, amount of nectar and grass height was collected. For the square an estimation of bush (woody plants below 3 meter in height) and tree (woody plants above 3 meter in height) cover was estimated in percentage in four directions (north, east, south and west). In the square an estimation of cover of thyme was also done (Table 1).
Variables collected in the habitat survey was analyzed using a Generalized linear model (GLM) where the non-butterfly points were compared with the butterfly points.
| Habitat variables | Description | 0,8 Æ squares | 10×10 meter Squares |
| Thymus plant cover | Cover in 10×10 m areas in square decimeters and in 0,8 Æ circles in square centimeters. | • | • |
| Woody vegetation below 3 m in height | Cover of woody vegetation in percent in four directions north/east/south/west. | • | |
| Woody vegetation above 3 m in height | Cover of woody vegetation in percent in four directions north/east/south/west. | • | |
| Grass height | Grass median height in cm in 10×10 m squares and 0,8 Æ squares | • | • |
| Nectar quantity | Nectar quantity in 0,8 Æ squares in per mille. | • | |
| GMI | Ground moisture index taken from Naturvårdsverket. | • |
1.5 Large scale habitat preferences in three categories
Three different types of hectare squares, based on the survival of P. arion,were chosen in the landscape, squares where the butterfly survived the drought of 2018, squares where they have never been seen and squares were they died out after 2018. These three different types were represented by 3, 4 and 5 squares. They were chosen to evaluate if certain habitat factors (T. serpyllum cover, GMI, tree and bush cover and Myrmica spp. abundance) had any effect on where P. arion survived the drought in 2018.