About the marsh fritillary
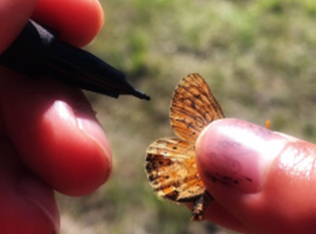
The marsh fritillary butterfly, Euphydryas aurinia has its adults flying from late May to late June. Females lay egg branches under the leaves of the host plant Succisa pratensis. The prediapause larvae are gregarious and after hatching spin a silken nest around the host plant. The larvae bask in the Sun until September when they enter diapause in a collective nest. They resume feeding and basking together in early spring, and when the need for food increase, they become more solitary.
Study area and suitable habitat patches
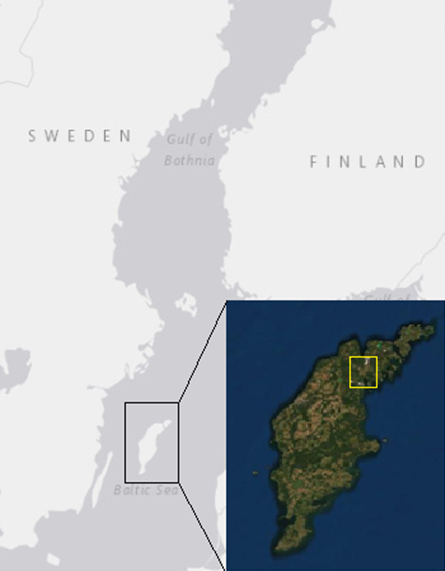
The study was conducted in a 50 km² (10 km x 5km) area close to Slite, on the Swedish island of Gotland, in the Baltic Sea. This area includes all the potential habitats for the species, considering potential dispersal distances studied in the region previously. In Gotland, the species inhabits wet parts of unfertilized calcareous wet grasslands. These areas remain naturally open, due to the slow accumulation of humus and nutrient-poor soil. The potential distribution of the species includes all open grassland patches where the host plant occurs.
Data collection
During the summer the adults were surveyed, from late May to late June. The surveys were conducted on days when the weather was beneficial for the occurrence of the butterfly (sunny warm days).
Species occurrence
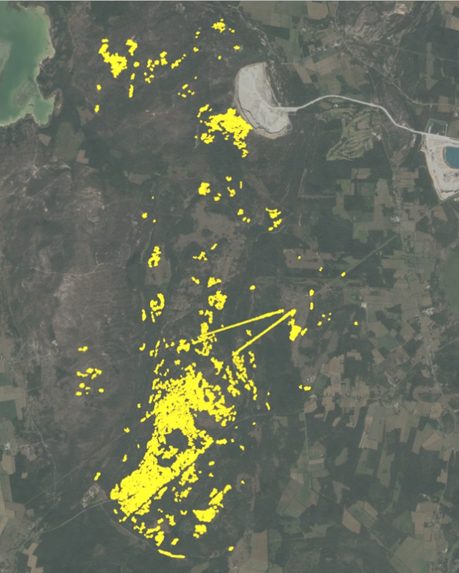
For studying species occurrence, suitable patches were visited to see if the butterfly was present, if no individual was found on the first visit the patch would be visited again, if after three visits no butterfly was found, the patch was considered unoccupied. Data on patch occupancy from 2020 was used to analyze colonization and extinction dynamics. Colonized patches were patches that were empty in 2020 and occupied in 2021, while patches occupied in 2020 but empty in 2021 had gone extinct.
Population size
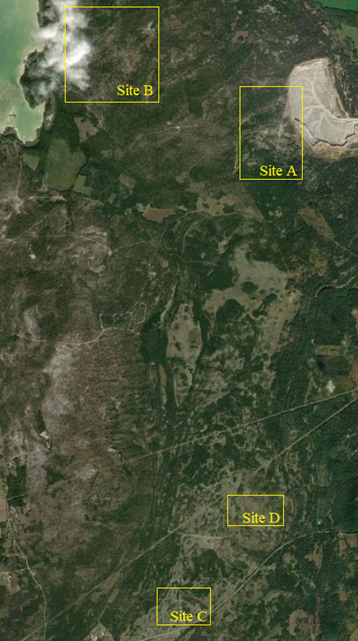
To follow the population recovery after the drought the population size was estimated with capture-mark-release (CMR). This survey was done in four subsets (sites A, B, C and D) of the patch network. These areas were visited daily and the butterflies were marked with permanent pen and immediately release at the point of capture.
Nectar survey
A nectar survey was conducted to compare the abundance of available nectar resources in the areas and the nectar resources used by the marsh fritillary. The data on nectar used by the butterflies were collected in the CMR survey, where if a butterfly was feeding at the time of capture, the used plant was registered. The data on the available nectar resources in the area were collected during the active period of the adults, in the same areas where the CMR surveys were conducted. Each of the four areas of CMR was subdivided into one-hectare cells, and six one-hectare grid cells were selected. The grid cells were chosen from the areas with a higher density of marsh fritillary. In each grid cell nine circular 0.5 m² plots with 80 cm of diameter, 25 meters apart, were visited once a week for a month, and for each visit all flowering species were identified.
Larvae occurrence and abundance
Data on the vegetation and larvae nests were collected in the autumn. For this survey, we had grid cells of one hectare distributed in suitable habitat, and in every grid cell, four meters wide transects were randomly distributed. The transects were walked through to check the presence of nests. When a nest was found it was encircled with a 0.5 m² plot with 80 cm of diameter, and inside of this plot I measured number of nests, number of host plants, vegetation height, presence of tussocks, number of stalks and length of the longest leaf of the host plant (a proxy for plant size). Then I collected data on average vegetation by randomly selecting 0.5 m² plots within transects regardless of the presence of nest. These were searched in the same way. This collection was performed in grazed and ungrazed areas. In some areas, where the nests were scarce, the entire grid cell was searched for nests, but the vegetation samples were still only made in the transect.
Data analysis
Occurrence, colonization and extinction probabilities were analyzed using generalized linear models with a binomial distribution (logistic regression). All three response variables were analyzed in relation to patch area, connectivity, mean of ground moisture index (GMI), tree cover and bush cover. The GMI is combined information from topography, depth of groundwater and soil type.
The estimation of the population size was done by using Jolly-Seber-Schwarz-Arnason models for open population. For the nectar survey, to see if flower use is opportunistic, the flower abundance and flowers utilized were correlated by the performance of a chi-squared test.
The association between larvae nests and habitat quality was analyzed at two scales. At the small scale, the difference between plots with larvae nests and random plots (without nests) was modeled based on the plot-scale explanatory variables (see above) using a generalized linear model with a binomial distribution. At the larger scale, the number of nests was related with variables for the one-hectare grid cell using a generalized linear model with a negative binomial distribution. The explanatory variables tested for the large-scale study were: habitat area, grazing, bush cover, three cover and GMI. All the analyses were performed in R.3.5.3 (Core Team, 2019). The final model was the one with the lowest AIC. To be able to see the influence of the variables in the models the difference in AIC was calculated when a variable is removed from the final model.