Choice of oviposition spots: Apollo
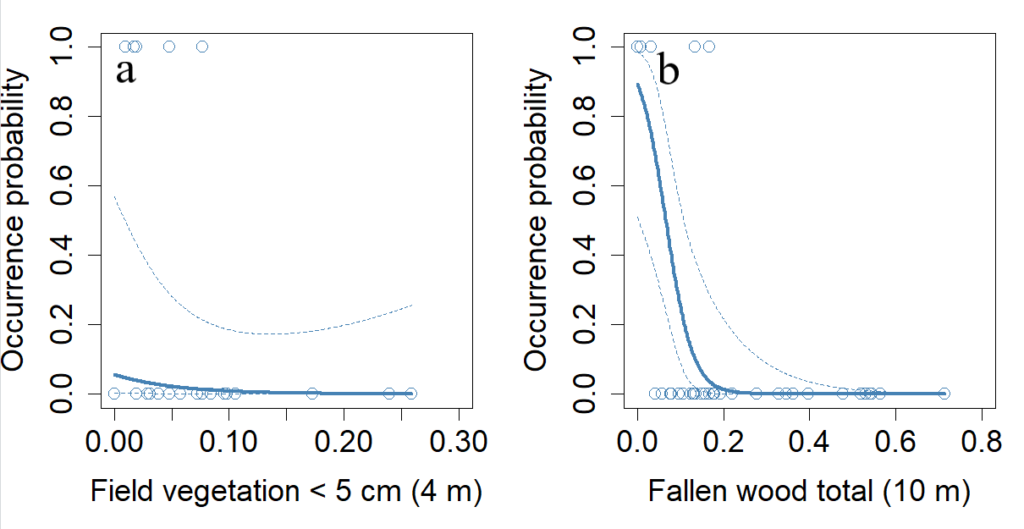
Oviposition behaviour was observed at 12 different spots, 8 of which had at least one egg for a total of 16 eggs. Oviposition substrates included juniper bushes (5 times), reindeer lichen (2 times) and Iceland moss (1 time). The probability of egg occurrence decreased with increasing proportions of fallen wood (e.g., sticks, bark, dead trees) on the ground within 10 m from the centre of the study plot (p = 0.011). In addition, the cover of < 5 cm field vegetation within 4 m from the centre was also included in the final model due to decreasing the AIC, despite only showing a weak negative relationship with egg occurrence (p = 0.18).
Choice of oviposition spots: Large Blue
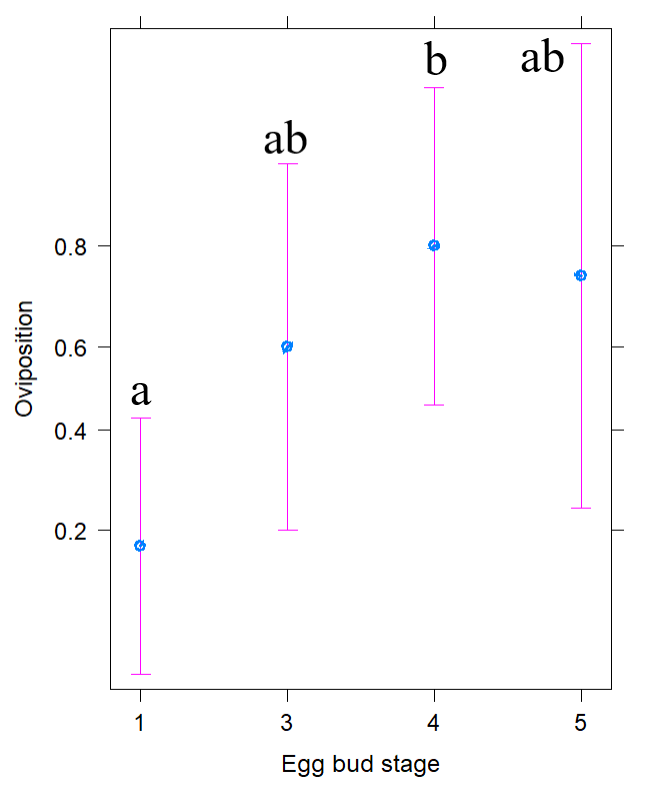
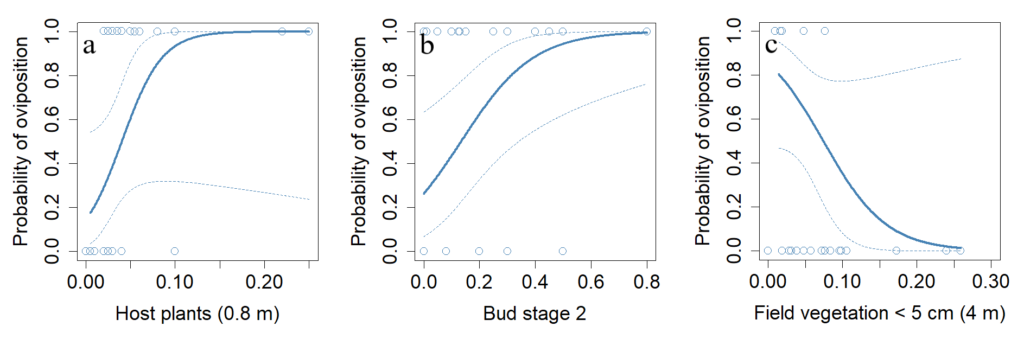
Eggs were found at only 3 of the 17 spots where oviposition behaviour occurred. For this reason, data collected at all instances that this behaviour occurred was included in the analysis. The probability of oviposition behaviour increased with increasing cover of host plants (p = 0.07), especially those with buds of developmental stage 2 (< 10 % opened, p = 0.012), within 0.8 m from the centre of the plot, and decreased with increasing < 5 cm field vegetation cover (p = 0.12). Moreover, the behaviour occurred significantly more often on developmental stage 4 (red bud) compared to stage 1 (bud primordium, p = 0.02).
Olfactory & sunlight orientation
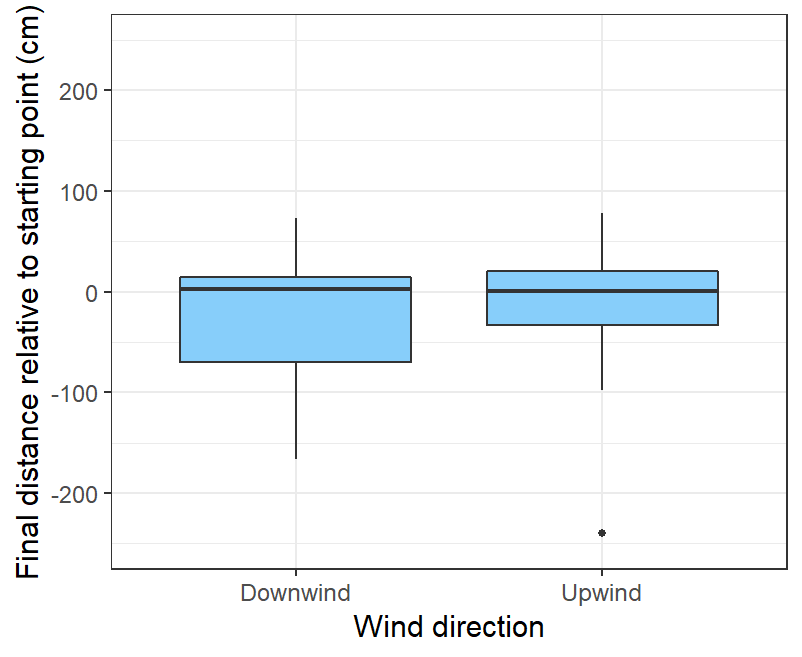
22 Apollo larvae were tested in total. For the olfactory orientation tests, no significant difference in the mean final distance to the host plant clusters could be found whether the larvae were released downwind or upwind from them (p = 0.71).
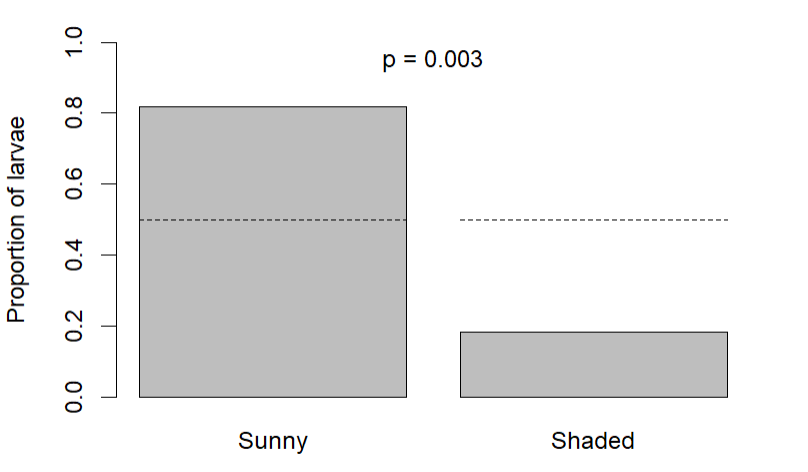
For the sunlight orientation tests, 18 larvae had a final position in a sunny spot while only 4 had a final position in a shaded spot. In other words, the proportions of larvae were 0.82 in sunny spots and 0.18 in shaded spots respectively, which were significantly different from the expected proportion of 0.5 (Chisq = 8.91, p = 0.003) if movements had been random.
Flight patterns and habitat preference
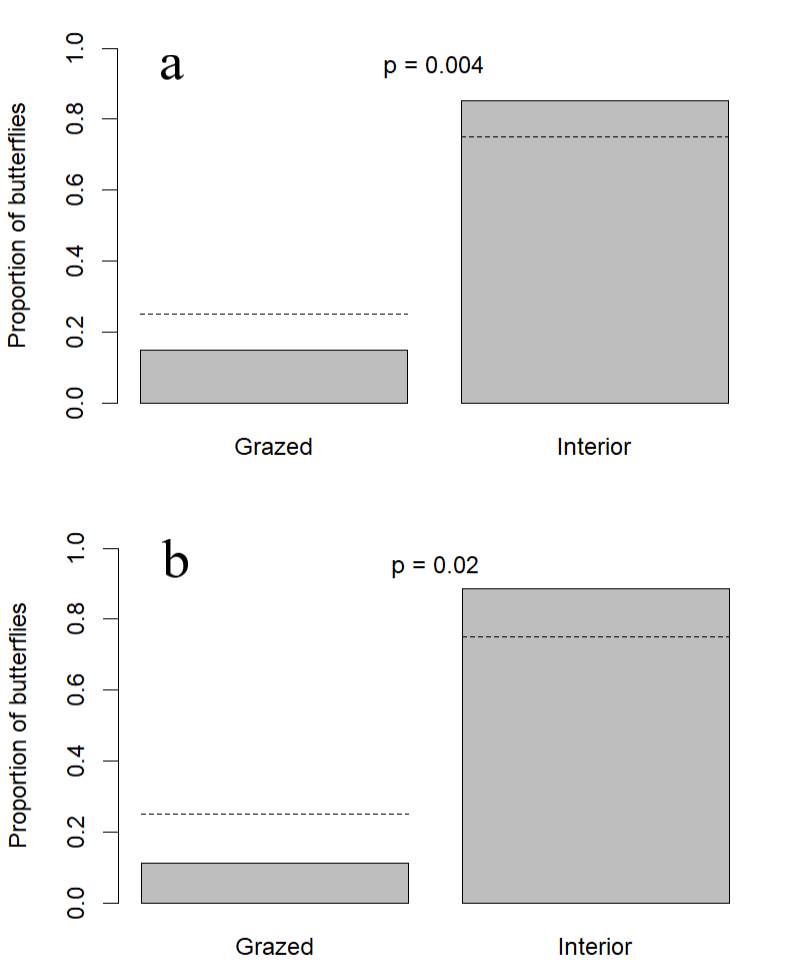
208 Marsh Fritillaries were studied in total. Out of all the individuals that completely crossed over the edges of the study plot, 22 crossed the grazed edge and 127 crossed the interior edges, which constitutes proportions of 0.15 and 0.85 respectively. The proportion of butterflies that crossed the grazed edge was significantly lower compared to the expected proportion of 0.25 (Chisq = 8.32, p = 0.004).
The number of individuals that returned to the plot after crossing over the edges was 6 for the grazed edge and 47 for the interior edges. This constitutes proportions of 0.11 and 0.89 for grazed and interior edges respectively, which meant that significantly fewer butterflies than expected returned after crossing over the grazed edge (Chisq = 5.29, p = 0.02).
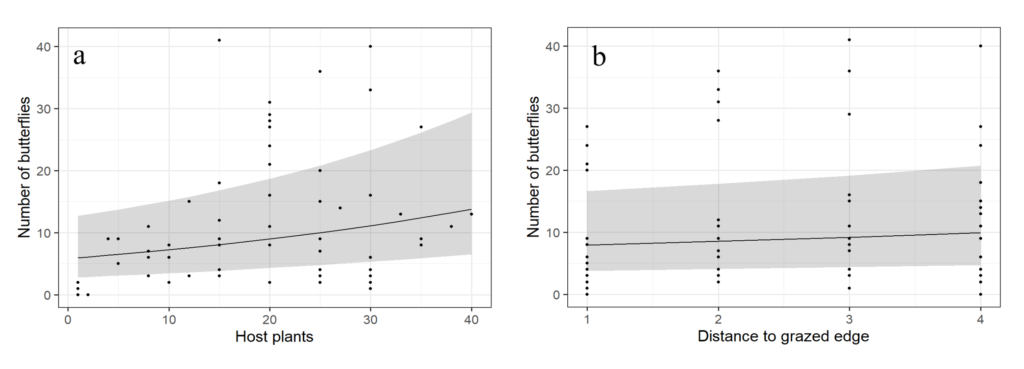
The number of butterflies that visited a certain square in the study plot was found to increase with increasing host plant cover (p < 0.0001) and the distance to the grazed edge (p = 0.023). When tested separately, nectar plant cover also showed a significant positive relationship with the number of visiting butterflies (p < 0.001), but this variable did not improve the AIC of the final model.