Department of Physics, Chemistry and Biology (IFM)
Results
Long-term analyses
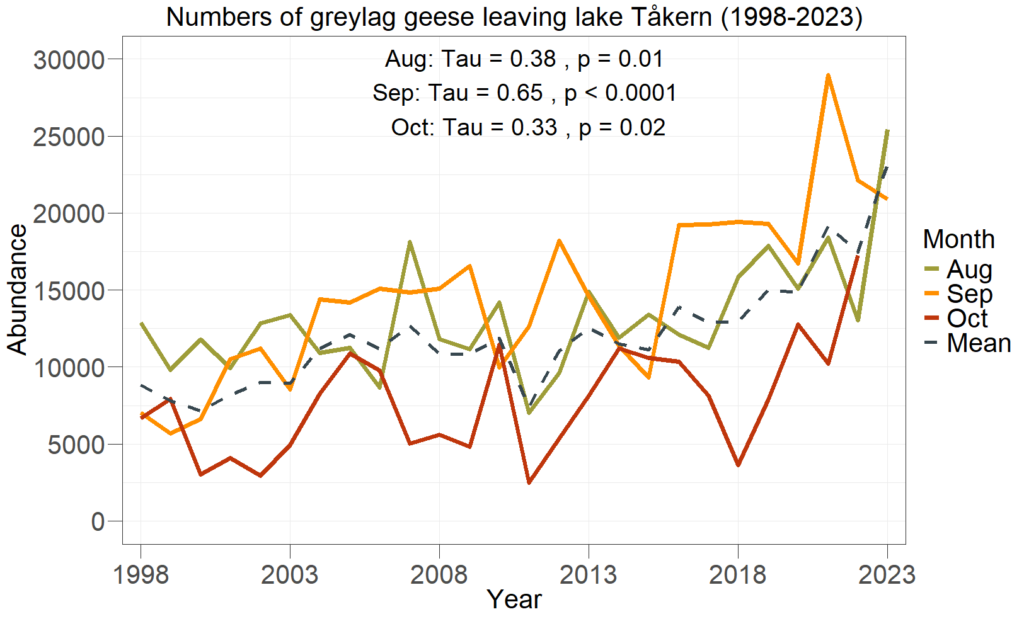
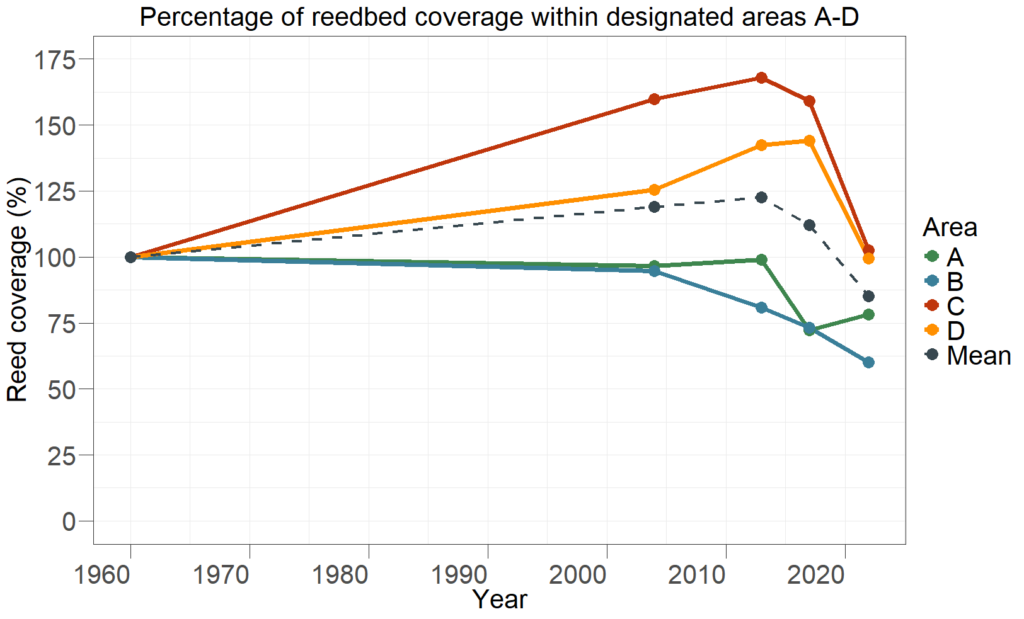
The long-term analyses showed an increase in geese numbers since 1998 (Fig. 6), and a decline in reed coverage in recent decades across four reed areas (Fig. 7).
Figure 6. Number of greylag geese leaving Lake Tåkern in early morning to feed in adjacent pastures (1998-2023).
Figure 7. Percentage of reedbed coverage within designated areas A-D (1960-2022), (The percent change is illustrated in relationship to the cover in 1960).
Field exclosure experiment
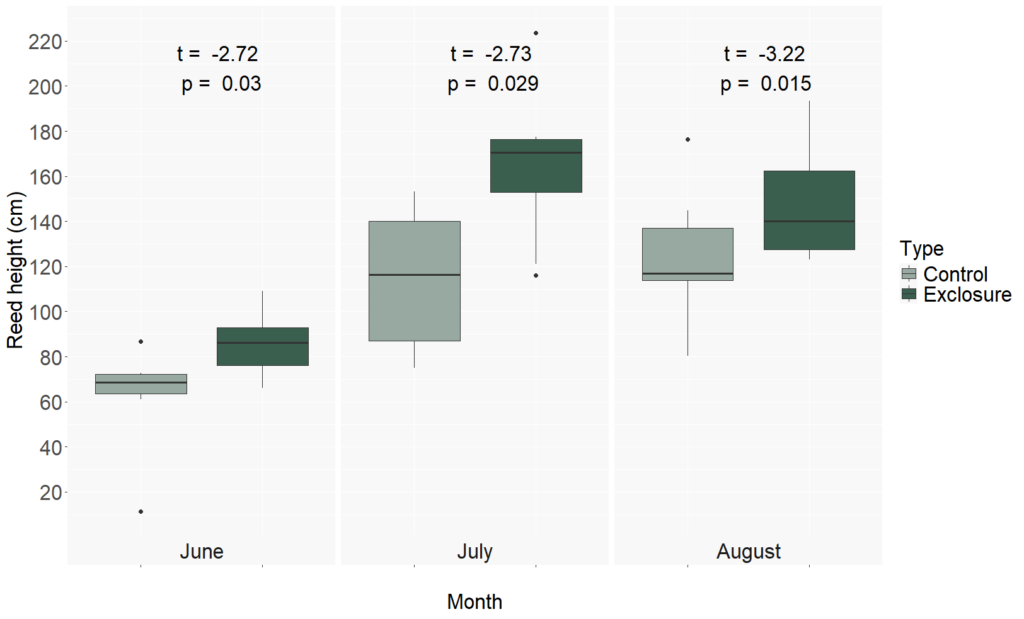
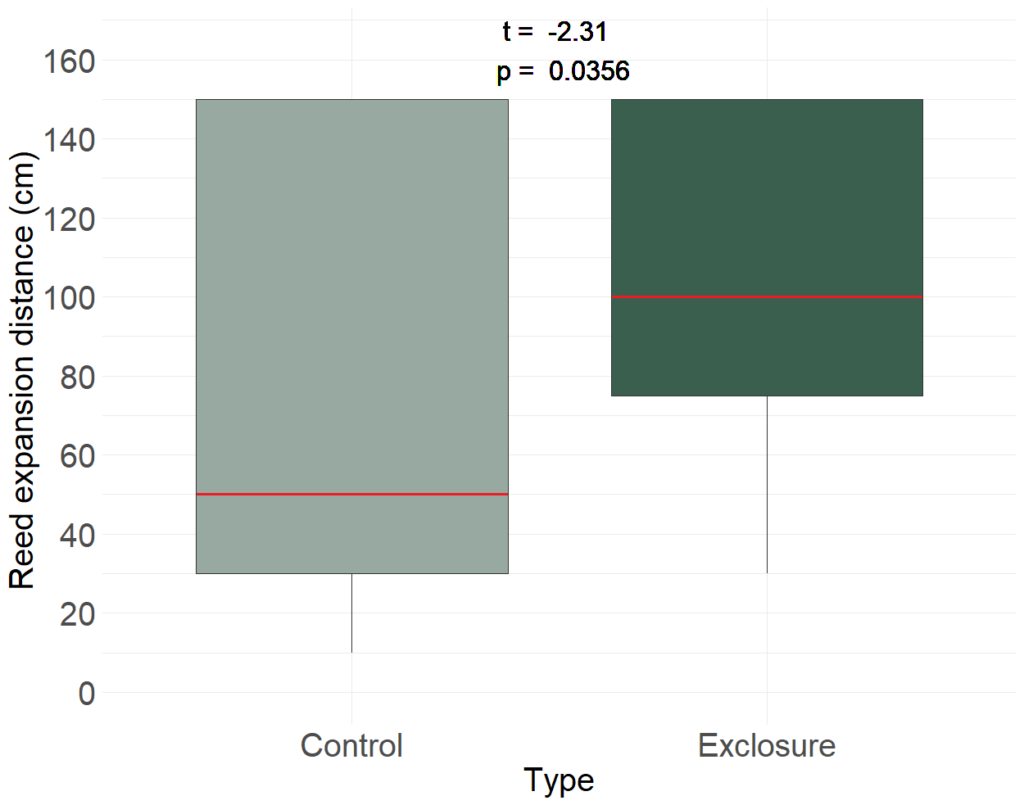
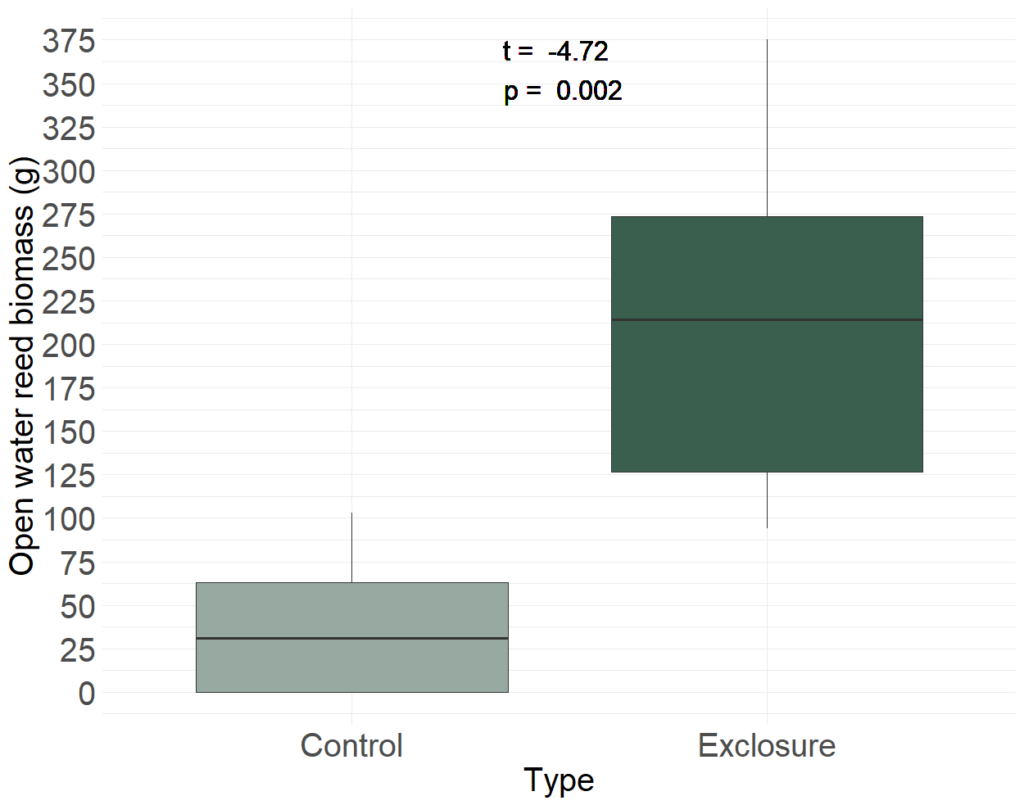
The exclosure experiment showed that geese exclusion significantly affected reed growth. Shoots in control sites were shorter by June, and this difference persisted throughout the season (Fig. 8). By late August, reeds had expanded further into open water within the exclosures (Fig. 9), and final reed biomass was higher (Fig. 10).
Figure 8. Reed stem height (cm) at three sampling occasions (1 June; 26 July; 27 August) in control sites and exclosures, excluding grazed stems heights. Pairwise t-test results are presented atop the graphs, n=8.
Figure 9Reed expansion distance (cm) from the edge of the established reedbed to the 150 cm limit, set by the length of the cage, at the end of the experiment on 28 August, in both control sites and exclosures, n=8.
Figure 10.Dry reed biomass (g) at the end of the experiment on 28 August in control sites and exclosures, in the open half of the cages, n=7.
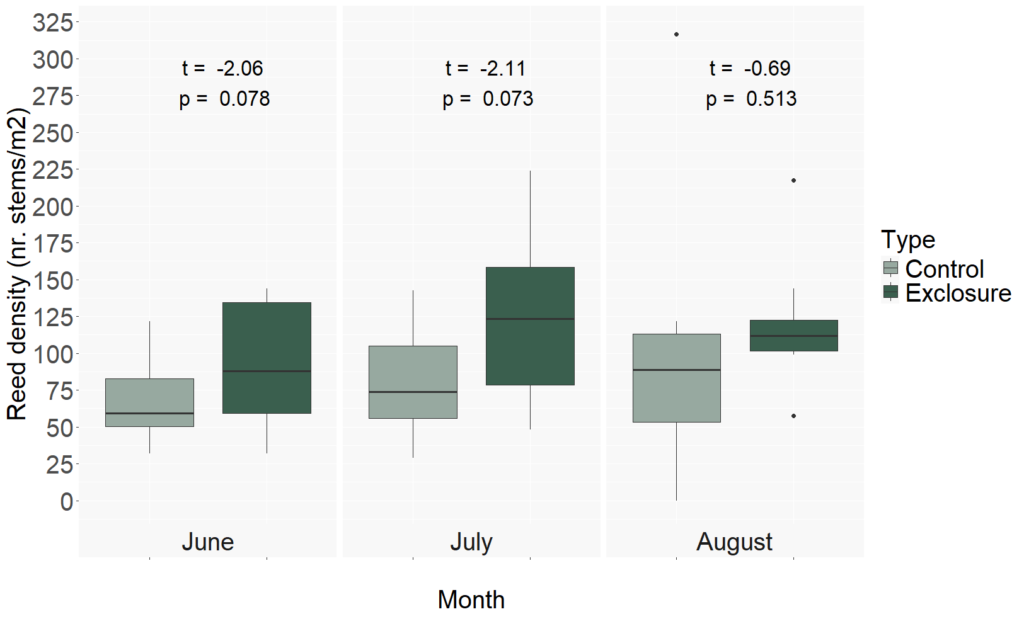
There was a tendency of higher reed stem density in June and July in exclosures compared to controls (Fig. 11). However, in August, density in the exclosures levelled off, while it reached its peak in the controls, making the difference statistically insignificant.
Figure 11.Reed density (stems/m²) in three sampling occasions (1 June; 26 July; 27 August) in control sites and exclosures, n=8.