Spontaneous preference test
I found that all ten animals increasingly preferred the larger of two simultaneously presented food pieces with increasing Weber ratio. In other words, when the size difference between the two food pieces increased, the animals showed an increase in choosing the larger-sized piece of food. Furthermore, less variation in individual preference was found with increasing Weber ratio (Figure 5).
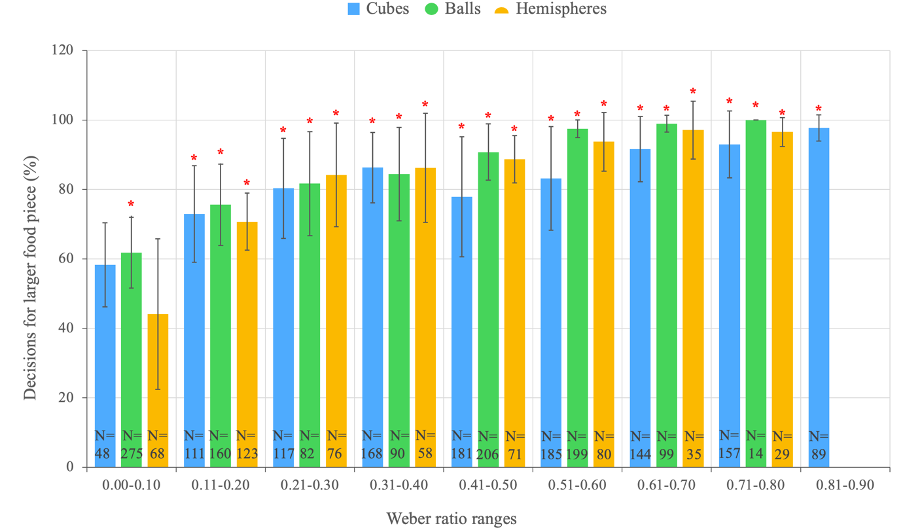
For the cube-shaped food the monkeys showed significant preferences from the Weber ratio range 0.11-0.20 onwards (one-sample Student’s t-test, p < 0.05). In other words, the group displayed on average a significant preference for the larger of two simultaneously presented cube-shaped food pieces when the size difference was at least 11% or larger.
For the ball-shaped food the monkeys showed significant preferences for all Weber ratio ranges (one-sample Student’s t-test, p < 0.05). In other words, the group displayed on average a significant preference for the larger of two simultaneously presented ball-shaped food pieces even for the smallest of size differences tested, when the food pieces differed by less than 10%.
For the hemisphere-shaped food the monkeys showed significant preferences from the Weber ratio range 0.11-0.20 onwards (one-sample Student’s t-test, p < 0.05). In other words, the group displayed on average a significant preference for the larger of two simultaneously presented hemisphere-shaped food pieces when the size difference was at least 11% or larger.
Comparing all three food shapes, the results show that the percentages of decisions for the larger of two simultaneously presented food pieces were generally higher when the pieces had the shape of a ball.
Operant conditioning test
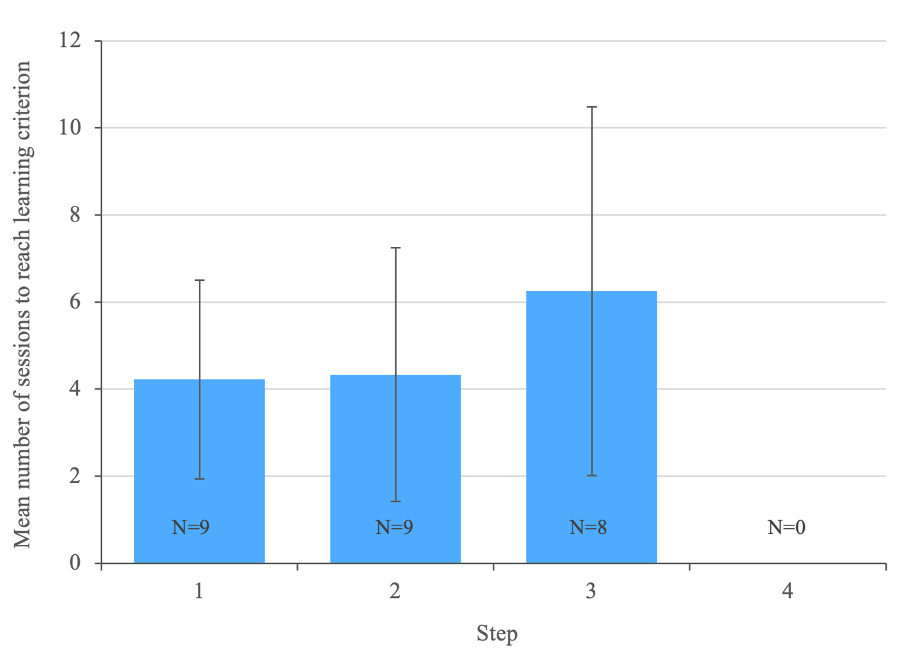
I found that the number of sessions the animals – as a group – required to meet the 80% learning criterion slightly increased for every step (Figure 6). The variation also slightly increased for every step, whereas the number of animals that successfully reached the learning criterion decreased. All nine animals successfully reached the learning criterion during steps one and two, representing those stimulus combinations with larger size differences between the wooden blocks. Eight out of nine animals were able to master the stimulus combinations of step three, representing more challenging stimulus combinations with smaller size differences between the wooden blocks. None of the nine animals mastered the stimulus combinations of step four, representing the most challenging stimulus combinations, within the allotted number of sessions.
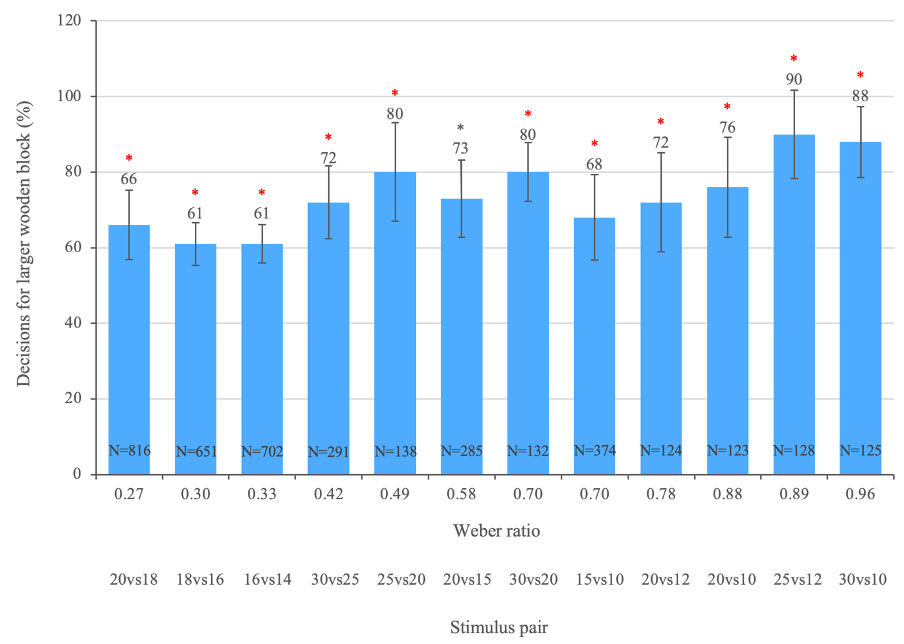
I found that all nine monkeys increasingly chose the larger of two simultaneously presented wooden blocks with increasing Weber ratio (Figure 7). In other words, with a larger size difference between two wooden blocks, the animals showed an increase in choosing the larger-sized wooden blocks. The animals – as a group – significantly chose the larger-sized wooden blocks for all Weber ratios, meaning all presented size differences (one-sample Student’s t-test, p < 0.05). They scored the lowest percentage of correct choices for the smallest Weber ratios: 0.27, 0.30 and 0.33, representing the most challenging stimulus combinations. Furthermore, less variation in individual performance is found for those three Weber ratios.